U-Haul 2009 Annual Report Download - page 34
Download and view the complete annual report
Please find page 34 of the 2009 U-Haul annual report below. You can navigate through the pages in the report by either clicking on the pages listed below, or by using the keyword search tool below to find specific information within the annual report.-
 1
1 -
2
-
3
-
4
-
5
-
6
-
7
-
8
-
9
-
10
-
11
-
12
-
13
-
14
-
15
-
16
-
17
-
18
-
19
-
20
-
21
-
22
-
23
-
 24
24 -
 25
25 -
 26
26 -
 27
27 -
 28
28 -
 29
29 -
 30
30 -
 31
31 -
 32
32 -
 33
33 -
 34
34 -
 35
35 -
 36
36 -
 37
37 -
 38
38 -
 39
39 -
 40
40 -
 41
41 -
 42
42 -
 43
43 -
 44
44 -
45
-
46
-
47
-
48
-
49
-
50
-
51
-
52
-
53
-
54
-
55
-
56
-
57
-
58
-
59
-
60
-
61
-
62
-
63
-
64
-
65
-
66
-
67
-
68
-
69
-
70
-
71
-
72
-
73
-
74
-
75
-
76
-
77
-
78
-
79
-
80
-
81
-
82
-
83
-
84
-
85
-
86
-
87
-
88
-
89
-
90
-
91
-
92
-
93
-
94
-
95
-
96
-
97
-
98
-
99
-
100
-
101
-
102
-
103
-
104
-
105
-
106
-
107
-
108
-
109
-
110
-
111
-
112
-
113
-
114
-
115
-
116
-
117
-
118
-
119
-
120
-
121
-
122
-
123
-
124
-
125
-
126
-
127
-
128
 |
 |

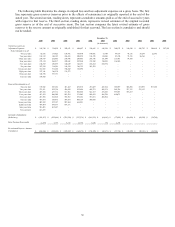
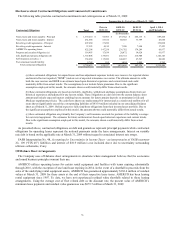
The following table illustrates the change in unpaid loss and loss adjustment expenses on a gross basis. The first
line represents gross reserves (reserves prior to the effects of reinsurance) as originally reported at the end of the
stated year. The second section, reading down, represents cumulative amounts paid as of the end of successive years
with respect to that reserve. The third section, reading down, represents revised estimates of the original recorded
gross reserve as of the end of successive years. The last section compares the latest revised estimate of gross
reserves to the reserve amount as originally established for that year-end. The last section is cumulative and should
not be totaled.
1998 1999 2000 2001 2002 2003 2004 2005 2006 2007 2008
Unpaid Loss and Loss
Adjustment Expenses 344,748$ 334,858$ 382,651$ 448,987$ 399,447$ 416,259$ 380,875$ 346,928$ 288,783$ 288,410$ 287,501$
Paid (Cumulative) as of:
One year later 82,936 117,025 130,471 130,070 100,851 73,384 44,677 40,116 35,297 22,701 -
Two years later 164,318 186,193 203,605 209,525 164,255 114,246 83,230 73,235 56,566 - -
Three years later 218,819 232,883 255,996 266,483 201,346 151,840 115,955 94,320 - - -
Four years later 255,134 264,517 299,681 295,268 233,898 184,219 136,940 - - - -
Five years later 274,819 295,997 320,629 322,191 263,654 204,752 - - - - -
Six years later 297,354 314,281 341,543 346,733 282,552 - - - - - -
Seven years later 311,963 331,385 358,882 364,696 - - - - - - -
Eight years later 327,141 346,270 371,277 - - - - - - - -
Nine years later 340,190 357,731 - - - - - - - - -
Ten years later 350,202 - - - - - - - - - -
Reserved Re-estimated as of:
One year later 339,602 383,264 433,222 454,510 471,029 447,524 388,859 326,386 319,951 307,200
Two years later 371,431 432,714 454,926 523,624 480,713 456,171 368,756 357,135 339,113 -
Three years later 429,160 437,712 517,361 500,566 521,319 435,549 399,693 376,357 - -
Four years later 413,476 480,200 543,554 571,045 502,922 466,709 418,873 - - -
Five years later 443,696 524,548 558,765 569,104 537,610 485,304 - - - -
Six years later 477,975 520,675 559,873 608,159 560,668 - - - - -
Seven years later 485,228 527,187 583,904 636,221 - - - - - -
Eight years later 496,484 550,333 614,171 - - - - - - -
Nine years later 521,403 567,307 - - - - - - - -
Ten years later 543,875 - - - - - - - - -
Cumulative Redundancy
(Deficiency) (199,127)$ (232,449)$ (231,520)$ (187,234)$ (161,221)$ (69,045)$ (37,998)$ (29,429)$ (50,330)$ (18,790)$
Retro Premium Recoverable (1,879) 6,797 5,613 21,756 7,036 374 2,233 - - -
Re-estimated Reserve: Amount
(Cumulative) (201,006)$ (225,652)$ (225,907)$ (165,478)$ (154,185)$ (68,671)$ (35,765)$ (29,429)$ (50,330)$ (18,790)$
(In thousands)
December 31,
30