U-Haul 2009 Annual Report Download - page 18
Download and view the complete annual report
Please find page 18 of the 2009 U-Haul annual report below. You can navigate through the pages in the report by either clicking on the pages listed below, or by using the keyword search tool below to find specific information within the annual report.-
 1
1 -
2
-
3
-
4
-
5
-
6
-
7
-
 8
8 -
 9
9 -
 10
10 -
 11
11 -
 12
12 -
 13
13 -
 14
14 -
 15
15 -
 16
16 -
 17
17 -
 18
18 -
 19
19 -
 20
20 -
 21
21 -
 22
22 -
 23
23 -
 24
24 -
 25
25 -
 26
26 -
 27
27 -
 28
28 -
29
-
30
-
31
-
32
-
33
-
34
-
35
-
36
-
37
-
38
-
39
-
40
-
41
-
42
-
43
-
44
-
45
-
46
-
47
-
48
-
49
-
50
-
51
-
52
-
53
-
54
-
55
-
56
-
57
-
58
-
59
-
60
-
61
-
62
-
63
-
64
-
65
-
66
-
67
-
68
-
69
-
70
-
71
-
72
-
73
-
74
-
75
-
76
-
77
-
78
-
79
-
80
-
81
-
82
-
83
-
84
-
85
-
86
-
87
-
88
-
89
-
90
-
91
-
92
-
93
-
94
-
95
-
96
-
97
-
98
-
99
-
100
-
101
-
102
-
103
-
104
-
105
-
106
-
107
-
108
-
109
-
110
-
111
-
112
-
113
-
114
-
115
-
116
-
117
-
118
-
119
-
120
-
121
-
122
-
123
-
124
-
125
-
126
-
127
-
128
 |
 |

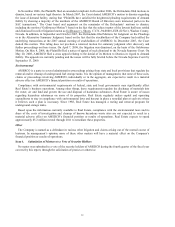
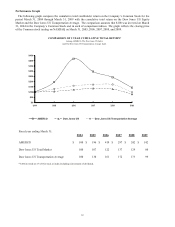
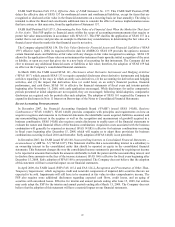
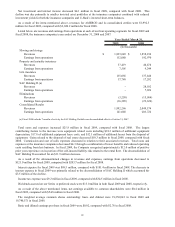
Performance Graph
The following graph compares the cumulative total stockholder return on the Company’s Common Stock for the
period March 31, 2004 through March 31, 2009 with the cumulative total return on the Dow Jones US Equity
Market and the Dow Jones US Transportation Average. The comparison assumes that $100 was invested on March
31, 2004 in the Company’s Common Stock and in each of comparison indices. The graph reflects the closing price
of the Common stock trading on NASDAQ on March 31, 2005, 2006, 2007, 2008, and 2009.
COMPARISON OF 5 YEAR CUMULATIVE TOTAL RETURN*
Among AMERCO, The Dow Jones US Index
And The Dow Jones US Transportation Average Index
$0
$50
$100
$150
$200
$250
$300
$350
$400
$450
3/04 3/05 3/06 3/07 3/08 3/09
AMERCO Dow Jones US Dow Jones US Transportation Average
Fiscal year ending March 31:
2004 2005 2006 2007 2008 2009
AMERCO $ 100 $ 196 $ 419 $ 297 $ 242 $ 142
Dow Jones US Total Market 100 107 122 137 129 80
Dow Jones US Transportation Average 100 130 161 172 173 99
* $100 invested on 3/31/04 in stock or index-including reinvestment of dividends.
14