U-Haul 2009 Annual Report Download - page 31
Download and view the complete annual report
Please find page 31 of the 2009 U-Haul annual report below. You can navigate through the pages in the report by either clicking on the pages listed below, or by using the keyword search tool below to find specific information within the annual report.-
 1
1 -
2
-
3
-
4
-
5
-
6
-
7
-
8
-
9
-
10
-
11
-
12
-
13
-
14
-
15
-
16
-
17
-
18
-
19
-
20
-
 21
21 -
 22
22 -
 23
23 -
 24
24 -
 25
25 -
 26
26 -
 27
27 -
 28
28 -
 29
29 -
 30
30 -
 31
31 -
 32
32 -
 33
33 -
 34
34 -
 35
35 -
 36
36 -
 37
37 -
 38
38 -
 39
39 -
 40
40 -
 41
41 -
42
-
43
-
44
-
45
-
46
-
47
-
48
-
49
-
50
-
51
-
52
-
53
-
54
-
55
-
56
-
57
-
58
-
59
-
60
-
61
-
62
-
63
-
64
-
65
-
66
-
67
-
68
-
69
-
70
-
71
-
72
-
73
-
74
-
75
-
76
-
77
-
78
-
79
-
80
-
81
-
82
-
83
-
84
-
85
-
86
-
87
-
88
-
89
-
90
-
91
-
92
-
93
-
94
-
95
-
96
-
97
-
98
-
99
-
100
-
101
-
102
-
103
-
104
-
105
-
106
-
107
-
108
-
109
-
110
-
111
-
112
-
113
-
114
-
115
-
116
-
117
-
118
-
119
-
120
-
121
-
122
-
123
-
124
-
125
-
126
-
127
-
128
 |
 |

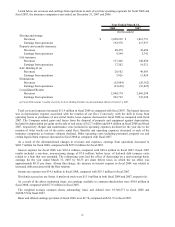
Moving and Storage
Fiscal 2009 Compared with Fiscal 2008
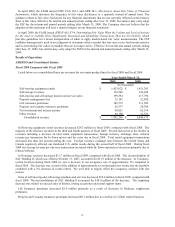
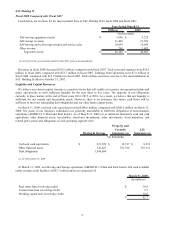
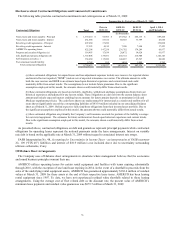
Listed below are revenues for the major product lines at our Moving and Storage Operating Segment for fiscal
2009 and fiscal 2008:
2009 2008
Self-moving equipment rentals $ 1,423,330 $ 1,451,292
Self-storage revenues 110,548 110,779
Self-moving and self-storage product and service sales 199,394 207,759
Property management fees 23,192 24,520
Net investment and interest income 29,865 34,906
Other revenue 36,720 28,974
Moving and Storage revenue $ 1,823,049 $ 1,858,230
(In thousands)
Year Ended March 31,
Self-moving equipment rental revenues decreased $28.0 million in fiscal 2009, compared with fiscal 2008. The
majority of the decrease occurred in the third and fourth quarters of fiscal 2009. Several factors led to the decline in
revenues including a decrease in total rental equipment transactions, foreign currency exchange rates, reduced
revenue per transaction for In-Town moves and the extra day in fiscal 2008. Total rental equipment transactions
decreased less than one percent during the year. Foreign currency exchange rates between the United States and
Canada negatively affected our translated U.S. dollar results during the second half of fiscal 2009. During fiscal
2009 our average revenue per one-way transactions increased while In-Town experienced decreases primarily due to
reduced mileage.
Self-storage revenues decreased $0.2 million in fiscal 2009, compared with fiscal 2008. At Company-owned
locations during fiscal 2009 we saw a decrease in our occupancy rate of approximately 5% compared to fiscal 2008.
The decrease was a result of the addition of approximately seven thousand new rooms into the portfolio combined
with a 2% decrease in rooms rented. We were able to largely offset the occupancy declines with rate actions.
Sales of self-moving and self-storage products and services decreased $8.4 million in fiscal 2009, compared with
fiscal 2008 with the decrease primarily related to reduced sales of hitches, towing accessories and rental support
items.
Net investment and interest income decreased $5.0 million in fiscal 2009, compared with fiscal 2008 due to lower
investment yields on the Company’s invested short-term cash balances.
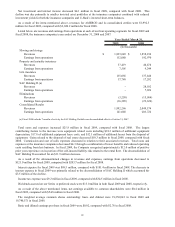
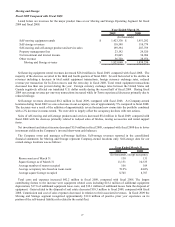
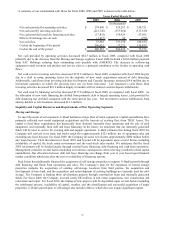
The Company owns and manages self-storage facilities. Self-storage revenues reported in the consolidated
financial statements for Moving and Storage represent Company-owned locations only. Self-storage data for our
owned storage locations was as follows:
2009 2008
Room count as of March 31 138 131
Square footage as of March 31 11,131 10,533
Average number of rooms occupied 106 109
Average occupancy rate based on room count 78.9% 84.0%
Average square footage occupied 8,745 8,767
Year Ended March 31,
(In thousands, except occupancy
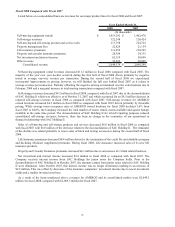
Total costs and expenses increased $42.2 million in fiscal 2009, compared with fiscal 2008. The largest
contributing factors to the increase were equipment related costs including $18.2 million of additional equipment
depreciation, $17.8 of additional equipment lease costs, and $12.1 million of additional losses from the disposal of
equipment. Gains related to the disposal of real estate decreased $10.3 million in fiscal 2009, compared with fiscal
2008. Commission and cost of sales expenses decreased in relation to their associated revenues. In fiscal 2009 the
Moving and Storage segment recognized approximately $12.0 million of positive prior year experience on its
portion of the self-insured liability risk related to the rental fleet.
27