U-Haul 2009 Annual Report Download - page 20
Download and view the complete annual report
Please find page 20 of the 2009 U-Haul annual report below. You can navigate through the pages in the report by either clicking on the pages listed below, or by using the keyword search tool below to find specific information within the annual report.-
 1
1 -
2
-
3
-
4
-
5
-
6
-
7
-
8
-
9
-
 10
10 -
 11
11 -
 12
12 -
 13
13 -
 14
14 -
 15
15 -
 16
16 -
 17
17 -
 18
18 -
 19
19 -
 20
20 -
 21
21 -
 22
22 -
 23
23 -
 24
24 -
 25
25 -
 26
26 -
 27
27 -
 28
28 -
 29
29 -
 30
30 -
31
-
32
-
33
-
34
-
35
-
36
-
37
-
38
-
39
-
40
-
41
-
42
-
43
-
44
-
45
-
46
-
47
-
48
-
49
-
50
-
51
-
52
-
53
-
54
-
55
-
56
-
57
-
58
-
59
-
60
-
61
-
62
-
63
-
64
-
65
-
66
-
67
-
68
-
69
-
70
-
71
-
72
-
73
-
74
-
75
-
76
-
77
-
78
-
79
-
80
-
81
-
82
-
83
-
84
-
85
-
86
-
87
-
88
-
89
-
90
-
91
-
92
-
93
-
94
-
95
-
96
-
97
-
98
-
99
-
100
-
101
-
102
-
103
-
104
-
105
-
106
-
107
-
108
-
109
-
110
-
111
-
112
-
113
-
114
-
115
-
116
-
117
-
118
-
119
-
120
-
121
-
122
-
123
-
124
-
125
-
126
-
127
-
128
 |
 |

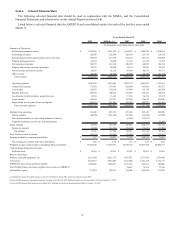
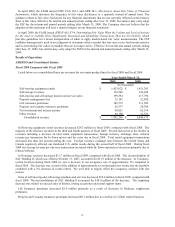
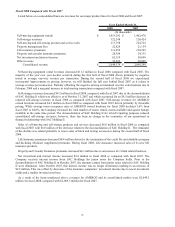
Item 6.
Selected Financial Data
The following selected financial data should be read in conjunction with the MD&A, and the Consolidated
Financial Statements and related notes in this Annual Report on Form 10-K.
Listed below is selected financial data for AMERCO and consolidated entities for each of the last five years ended
March 31:
2009 2008 (b), (c) 2007 2006 2005
Summary of Operations:
Self-moving equipment rentals $ 1,423,022 $ 1,451,292 $ 1,462,470 $ 1,489,429 $ 1,424,841
Self-storage revenues 110,548 122,248 126,424 119,742 114,155
Self-moving and self-storage products and service sales 199,394 217,798 224,722 223,721 206,098
Property management fees 23,192 22,820 21,154 21,195 11,839
Life insurance premiums 109,572 111,996 120,399 118,833 126,236
Property and casualty insurance premiums 28,337 28,388 24,335 26,001 24,987
Net investment and interest income 58,021 62,110 59,696 48,279 49,171
Other revenue 40,180 32,522 30,098 40,325 30,172
Total revenues 1,992,266 2,049,174 2,069,298 2,087,525 1,987,499
Operating expenses 1,047,238 1,079,486 1,082,178 1,083,887 1,125,663
Commission expenses 171,303 167,945 162,899 165,961 159,253
Cost of sales 114,387 120,210 117,648 113,135 105,309
Benefits and losses 108,259 108,817 116,959 115,431 138,655
Amortization of deferred policy acquisition costs 12,394 13,181 17,138 24,261 28,512
Lease expense 152,424 133,931 147,659 136,652 142,008
Depreciation, net of (gains) losses on disposal 265,213 221,882 189,589 142,817 121,103
Total costs and expenses 1,871,218 1,845,452 1,834,070 1,782,144 1,820,503
Earnings from operations 121,048 203,722 235,228 305,381 166,996
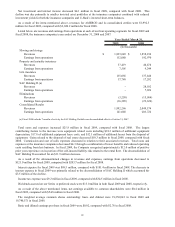
Interest expense (98,470) (101,420) (82,436) (69,481) (73,205)
Fees and amortization on early extinguishment of debt (a) - - (6,969) (35,627) -
Litigation settlement, net of costs, fees and expenses - - - - 51,341
Pretax earnings 22,578 102,302 145,823 200,273 145,132
Income tax expense (9,168) (34,518) (55,270) (79,119) (55,708)
Net earnings 13,410 67,784 90,553 121,154 89,424
Less: Preferred stock dividends (12,963) (12,963) (12,963) (12,963) (12,963)
Earnings available to common shareholders $ 447 $ 54,821 $ 77,590 $ 108,191 $ 76,461
Net earnings per common share basic and diluted $ 0.02 $ 2.78 $ 3.72 $ 5.19 $ 3.68
Weighted average common shares outstanding: Basic and diluted 19,350,041 19,740,571 20,838,570 20,857,108 20,804,773
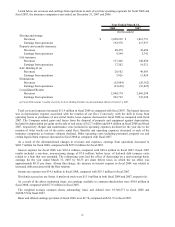
Cash dividends declared and accrued
Preferred stock $ 12,963 $ 12,963 $ 12,963 $ 12,963 $ 12,963
Balance Sheet Data:
Property, plant and equipment, net 2,013,928 2,011,176 1,897,071 1,535,165 1,354,468
Total assets 3,825,073 3,832,487 3,523,048 3,367,218 3,116,173
AMERCO's notes, loans and leases payable 1,546,490 1,504,677 1,181,165 965,634 780,008
SAC Holding II notes and loans payable, non re-course to AMERCO - - 74,887 76,232 77,474
Stockholders' equity 717,629 758,431 718,098 695,604 572,839
(a) Includes the write-off of debt issuance costs of $7.0 million in fiscal 2007 and $14.4 million in fiscal 2006.
(b) Fiscal 2008 summary of operations includes 7 months of activity for SAC Holding II which was deconsolidated effective October 31, 2007.
(c) Fiscal 2008 balance sheet data does not include SAC Holding II which was deconsolidated effective October 31, 2007.
Years Ended March 31,
(In thousands, except share and per share data)
16