U-Haul 2009 Annual Report Download - page 73
Download and view the complete annual report
Please find page 73 of the 2009 U-Haul annual report below. You can navigate through the pages in the report by either clicking on the pages listed below, or by using the keyword search tool below to find specific information within the annual report.-
 1
1 -
2
-
3
-
4
-
5
-
6
-
7
-
8
-
9
-
10
-
11
-
12
-
13
-
14
-
15
-
16
-
17
-
18
-
19
-
20
-
21
-
22
-
23
-
24
-
25
-
26
-
27
-
28
-
29
-
30
-
31
-
32
-
33
-
34
-
35
-
36
-
37
-
38
-
39
-
40
-
41
-
42
-
43
-
44
-
45
-
46
-
47
-
48
-
49
-
50
-
51
-
52
-
53
-
54
-
55
-
56
-
57
-
58
-
59
-
60
-
61
-
62
-
 63
63 -
 64
64 -
 65
65 -
 66
66 -
 67
67 -
 68
68 -
 69
69 -
 70
70 -
 71
71 -
 72
72 -
 73
73 -
 74
74 -
 75
75 -
 76
76 -
 77
77 -
 78
78 -
 79
79 -
 80
80 -
 81
81 -
 82
82 -
 83
83 -
84
-
85
-
86
-
87
-
88
-
89
-
90
-
91
-
92
-
93
-
94
-
95
-
96
-
97
-
98
-
99
-
100
-
101
-
102
-
103
-
104
-
105
-
106
-
107
-
108
-
109
-
110
-
111
-
112
-
113
-
114
-
115
-
116
-
117
-
118
-
119
-
120
-
121
-
122
-
123
-
124
-
125
-
126
-
127
-
128
 |
 |

AMERCO AND CONSOLIDATED ENTITIES
NOTES TO CONSOLIDATED FINANCIAL STATEMENTS -- (CONTINUED)
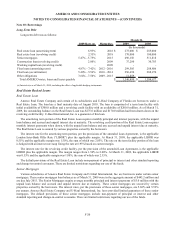
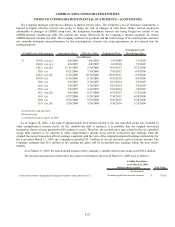
The Company sold available-for-sale securities with a fair value of $234.2 million in 2008, $134.6 million in 2007 and
$113.4 million in 2006. The gross realized gains on these sales totaled $0.7 million in 2008, $0.4 million in 2007 and $1.6
million in 2006. The Company realized gross losses on these sales of $0.5 million in 2008, $0.4 million in 2007 and $1.9
million in 2006.
The unrealized losses of more than twelve months in the table on the previous page are considered temporary declines.
The Company tracks each investment with an unrealized loss and evaluates them on an individual basis for other-than-
temporary impairments including obtaining corroborating opinions from third party sources, performing trend analysis and
reviewing management’s future plans. Certain of these investments had declines determined by management to be other-
than-temporary and the Company recognized these write-downs through earnings in the amounts of approximately $0.4
million in 2008, $0.5 million in 2007 and $1.4 million in 2006.
The investment portfolio primarily consists of Corporate securities and U.S. Government securities. The Company
believes it monitors its investments as appropriate. The Company’s methodology of assessing other-than-temporary
impairments is based on security-specific analysis as of the balance sheet date and considers various factors including the
length of time to maturity and the extent to which the fair value has been less than the cost, the financial condition and the
near-term prospects of the issuer, and whether the debtor is current on its contractually obligated interest and principal
payments. Nothing has come to management’s attention that would lead to the belief that each issuer would not have the
ability to meet the remaining contractual obligations of the security, including payment at maturity. The Company has the
ability and intent to hold its fixed maturity investments for a period of time sufficient to allow the Company to recover its
costs.
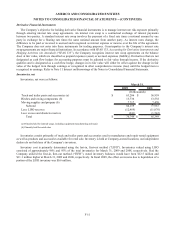
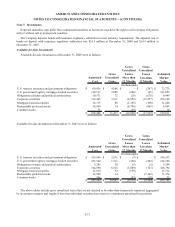
The adjusted cost and estimated market value of available-for-sale investments at December 31, 2008 and December 31,
2007, by contractual maturity, were as follows:
Amortized
Cost
Estimated
Market
Value
Amortized
Cost
Estimated
Market
Value
Due in one year or less $ 44,978 $ 44,880 $ 74,500 $ 74,615
Due after one year through five years 139,050 133,936 189,321 191,073
Due after five years through ten years 77,521 76,456 117,726 118,815
After ten years 249,560 244,273 218,162 222,342
511,109 499,545 599,709 606,845
Mortgage backed securities 12,713 11,208 15,618 15,512
Redeemable preferred stocks 14,509 8,868 12,509 11,374
Equity securities 75 10 106 53
$ 538,406 $ 519,631 $ 627,942 $ 633,784
December 31, 2008 December 31, 2007
(In thousands)
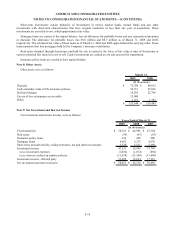
Investments, other
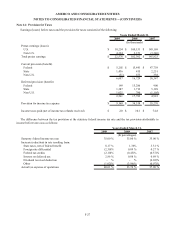
The carrying value of other investments was as follows:
2009 2008
Short-term investments $ 123,769 $ 101,638
Mortgage loans, net 76,908 58,015
Real estate 17,851 17,289
Policy loans 4,394 4,585
Other equity investments 4,100 4,064
$ 227,022 $ 185,591
March 31,
(In thousands)
F-18