U-Haul 2009 Annual Report Download - page 42
Download and view the complete annual report
Please find page 42 of the 2009 U-Haul annual report below. You can navigate through the pages in the report by either clicking on the pages listed below, or by using the keyword search tool below to find specific information within the annual report.-
 1
1 -
2
-
3
-
4
-
5
-
6
-
7
-
8
-
9
-
10
-
11
-
12
-
13
-
14
-
15
-
16
-
17
-
18
-
19
-
20
-
21
-
22
-
23
-
24
-
25
-
26
-
27
-
28
-
29
-
30
-
31
-
 32
32 -
 33
33 -
 34
34 -
 35
35 -
 36
36 -
 37
37 -
 38
38 -
 39
39 -
 40
40 -
 41
41 -
 42
42 -
 43
43 -
 44
44 -
 45
45 -
 46
46 -
 47
47 -
 48
48 -
 49
49 -
 50
50 -
 51
51 -
 52
52 -
53
-
54
-
55
-
56
-
57
-
58
-
59
-
60
-
61
-
62
-
63
-
64
-
65
-
66
-
67
-
68
-
69
-
70
-
71
-
72
-
73
-
74
-
75
-
76
-
77
-
78
-
79
-
80
-
81
-
82
-
83
-
84
-
85
-
86
-
87
-
88
-
89
-
90
-
91
-
92
-
93
-
94
-
95
-
96
-
97
-
98
-
99
-
100
-
101
-
102
-
103
-
104
-
105
-
106
-
107
-
108
-
109
-
110
-
111
-
112
-
113
-
114
-
115
-
116
-
117
-
118
-
119
-
120
-
121
-
122
-
123
-
124
-
125
-
126
-
127
-
128
 |
 |

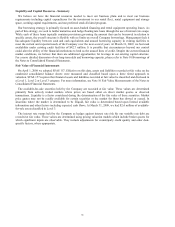
Property and Casualty Insurance will continue to provide loss adjusting and claims handling for U-Haul and
underwrite components of the Safemove, Safetow and Safestor protection packages to U-Haul customers.
Life Insurance is pursuing its goal of expanding its presence in the senior market through the sales of its Medicare
supplement, life and annuity policies. This strategy includes growing its agency force, expanding its new product
offerings, and pursuing business acquisition opportunities.
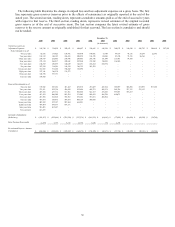
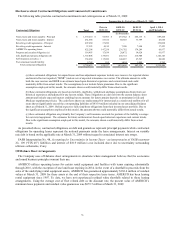
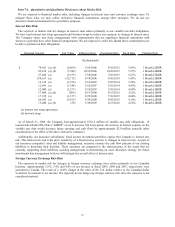
Quarterly Results (unaudited)
The quarterly results shown below are derived from unaudited financial statements for the eight quarters
beginning April 1, 2007 and ending March 31, 2009. The Company believes that all necessary adjustments have
been included in the amounts stated below to present fairly, and in accordance with GAAP, such results. Moving
and Storage operations are seasonal and proportionally more of the Company’s revenues and net earnings from its
Moving and Storage operations are generated in the first and second quarters of each fiscal year (April through
September). The operating results for the periods presented are not necessarily indicative of results for any future
period.
March 31,
2009
December 31,
2008
September 30,
2008
June 30,
2008
Total revenues $ 415,393 $ 442,584 $ 591,495 $ 542,794
Earnings (loss) from operations (32,135) (14,001) 95,522 71,662
Net earnings (loss) (35,288) (24,952) 43,824 29,826
Earnings (loss) available to common
shareholders (38,528) (28,193) 40,583 26,585
Weighted average common shares
outstanding: basic and diluted 19,357,185 19,347,660 19,351,322 19,343,184
Earnings (loss) per common share:
Basic and diluted $ (1.99) $ (1.46) $ 2.10 $ 1.37
Quarter Ended
(In thousands, except for share and per share data)
March 31,
2008
December 31,
2007
September 30,
2007
June 30,
2007
Total revenues $ 433,097 $ 465,460 $ 596,342 $ 554,275
Earnings (loss) from operations (5,685) 8,323 109,080 92,004
Net earnings (loss) (14,048) (10,394) 50,474 41,752
Earnings (loss) available to common
shareholders (17,288) (13,635) 47,233 38,511
Weighted average common shares
outstanding: basic and diluted 19,544,707 19,746,237 19,733,755 19,937,152
Earnings (loss) per common share:
Basic and diluted $ (0.85) $ (0.69) $ 2.39 $ 1.93
Quarter Ended
(In thousands, except for share and per share data)
38