U-Haul 2009 Annual Report Download - page 43
Download and view the complete annual report
Please find page 43 of the 2009 U-Haul annual report below. You can navigate through the pages in the report by either clicking on the pages listed below, or by using the keyword search tool below to find specific information within the annual report.-
 1
1 -
2
-
3
-
4
-
5
-
6
-
7
-
8
-
9
-
10
-
11
-
12
-
13
-
14
-
15
-
16
-
17
-
18
-
19
-
20
-
21
-
22
-
23
-
24
-
25
-
26
-
27
-
28
-
29
-
30
-
31
-
32
-
 33
33 -
 34
34 -
 35
35 -
 36
36 -
 37
37 -
 38
38 -
 39
39 -
 40
40 -
 41
41 -
 42
42 -
 43
43 -
 44
44 -
 45
45 -
 46
46 -
 47
47 -
 48
48 -
 49
49 -
 50
50 -
 51
51 -
 52
52 -
 53
53 -
54
-
55
-
56
-
57
-
58
-
59
-
60
-
61
-
62
-
63
-
64
-
65
-
66
-
67
-
68
-
69
-
70
-
71
-
72
-
73
-
74
-
75
-
76
-
77
-
78
-
79
-
80
-
81
-
82
-
83
-
84
-
85
-
86
-
87
-
88
-
89
-
90
-
91
-
92
-
93
-
94
-
95
-
96
-
97
-
98
-
99
-
100
-
101
-
102
-
103
-
104
-
105
-
106
-
107
-
108
-
109
-
110
-
111
-
112
-
113
-
114
-
115
-
116
-
117
-
118
-
119
-
120
-
121
-
122
-
123
-
124
-
125
-
126
-
127
-
128
 |
 |

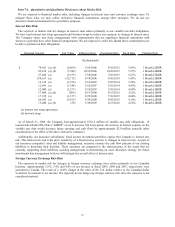
Item 7A. Quantitative and Qualitative Disclosures about Market Risk
We are exposed to financial market risks, including changes in interest rates and currency exchange rates. To
mitigate these risks, we may utilize derivative financial instruments, among other strategies. We do not use
derivative financial instruments for speculative purposes.
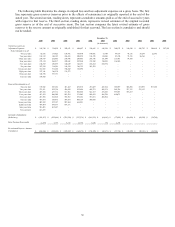
Interest Rate Risk
The exposure to market risk for changes in interest rates relates primarily to our variable rate debt obligations.
We have used interest rate swap agreements and forward swaps to reduce our exposure to changes in interest rates.
The Company enters into these arrangements with counterparties that are significant financial institutions with
whom we generally have other financial arrangements. We are exposed to credit risk should these counterparties not
be able to perform on their obligations.
Notional Amount Fair Value Effective Date Expiration Date Fixed Rate Floating Rate
$ 74,662 (a), (b) (6,460) 5/10/2006 4/10/2012 5.06% 1 Month LIBOR
82,818 (a), (b) (7,946) 10/10/2006 10/10/2012 5.57% 1 Month LIBOR
27,486 (a) (3,153) 7/10/2006 7/10/2013 5.67% 1 Month LIBOR
274,167 (a) (52,712) 8/18/2006 8/10/2018 5.43% 1 Month LIBOR
19,125 (a) (1,978) 2/12/2007 2/10/2014 5.24% 1 Month LIBOR
12,991 (a) (1,348) 3/10/2007 3/10/2014 4.99% 1 Month LIBOR
13,000 (a) (1,237) 3/10/2007 3/10/2014 4.99% 1 Month LIBOR
17,000 (a), (b) (965) 8/15/2008 6/15/2015 3.62% 1 Month LIBOR
17,338 (a) (1,157) 8/29/2008 7/10/2015 4.04% 1 Month LIBOR
26,982 (a) (2,105) 9/30/2008 9/10/2015 4.16% 1 Month LIBOR
15,000 (a), (b) (58) 3/30/2009 4/15/2016 2.63% 1 Month LIBOR
(a) interest rate swap agreemen
t
(In thousands)
(b) forward swap
As of March 31, 2009, the Company had approximately $781.8 million of variable rate debt obligations. If
London Inter-Bank Offer Rate (“LIBOR”) were to increase 100 basis points, the increase in interest expense on the
variable rate debt would decrease future earnings and cash flows by approximately $2.0 million annually (after
consideration of the effect of the above derivative contracts).
Additionally, our insurance subsidiaries’ fixed income investment portfolios expose the Company to interest rate
risk. This interest rate risk is the price sensitivity of a fixed income security to changes in interest rates. As part of
our insurance companies’ asset and liability management, actuaries estimate the cash flow patterns of our existing
liabilities to determine their duration. These outcomes are compared to the characteristics of the assets that are
currently supporting these liabilities assisting management in determining an asset allocation strategy for future
investments that management believes will mitigate the overall effect of interest rates.
Foreign Currency Exchange Rate Risk
The exposure to market risk for changes in foreign currency exchange rates relates primarily to our Canadian
business. Approximately 5.6%, 5.4% and 4.4% of our revenue in fiscal 2009, 2008 and 2007, respectively were
generated in Canada. The result of a 10.0% change in the value of the U.S. dollar relative to the Canadian dollar
would not be material to net income. We typically do not hedge any foreign currency risk since the exposure is not
considered material.
39