U-Haul 2009 Annual Report Download - page 27
Download and view the complete annual report
Please find page 27 of the 2009 U-Haul annual report below. You can navigate through the pages in the report by either clicking on the pages listed below, or by using the keyword search tool below to find specific information within the annual report.-
 1
1 -
2
-
3
-
4
-
5
-
6
-
7
-
8
-
9
-
10
-
11
-
12
-
13
-
14
-
15
-
16
-
 17
17 -
 18
18 -
 19
19 -
 20
20 -
 21
21 -
 22
22 -
 23
23 -
 24
24 -
 25
25 -
 26
26 -
 27
27 -
 28
28 -
 29
29 -
 30
30 -
 31
31 -
 32
32 -
 33
33 -
 34
34 -
 35
35 -
 36
36 -
 37
37 -
38
-
39
-
40
-
41
-
42
-
43
-
44
-
45
-
46
-
47
-
48
-
49
-
50
-
51
-
52
-
53
-
54
-
55
-
56
-
57
-
58
-
59
-
60
-
61
-
62
-
63
-
64
-
65
-
66
-
67
-
68
-
69
-
70
-
71
-
72
-
73
-
74
-
75
-
76
-
77
-
78
-
79
-
80
-
81
-
82
-
83
-
84
-
85
-
86
-
87
-
88
-
89
-
90
-
91
-
92
-
93
-
94
-
95
-
96
-
97
-
98
-
99
-
100
-
101
-
102
-
103
-
104
-
105
-
106
-
107
-
108
-
109
-
110
-
111
-
112
-
113
-
114
-
115
-
116
-
117
-
118
-
119
-
120
-
121
-
122
-
123
-
124
-
125
-
126
-
127
-
128
 |
 |

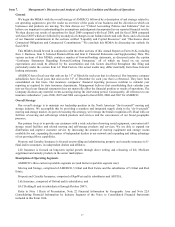
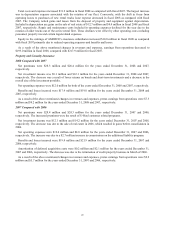
In April 2009, the FASB issued (FSP) FAS 107-1 and APB 28-1, Disclosures about Fair Value of Financial
Instruments, which increases the frequency of fair value disclosures to a quarterly instead of annual basis. The
guidance relates to fair value disclosures for any financial instruments that are not currently reflected on the balance
sheet at fair value. Effective for interim and annual periods ending after June 15, 2009, but entities may early adopt
the FSP for the interim and annual periods ending after March 15, 2009. The Company does not believe that the
adoption of this statement will have a material impact on our financial statements.
In April 2009, the FASB issued (FSP) FAS 157-4, Determining Fair Value When the Volume and Level of Activity
for the Asset or Liability Have Significantly Decreased and Identifying Transactions That Are Not Orderly, which
provides guidelines for a broad interpretation of when to apply market-based fair value measurements. The FSP
reaffirms management's need to use judgment to determine when a market that was once active has become inactive
and in determining fair values in markets that are no longer active. Effective for interim and annual periods ending
after June 15, 2009, but entities may early adopt the FSP for the interim and annual periods ending after March 15,
2009.
Results of Operations
AMERCO and Consolidated Entities
Fiscal 2009 Compared with Fiscal 2008
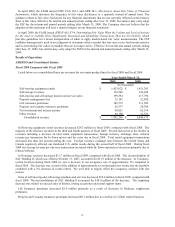
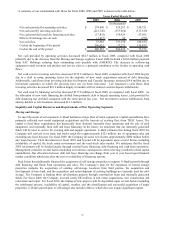
Listed below on a consolidated basis are revenues for our major product lines for fiscal 2009 and fiscal 2008:
2009 2008
Self-moving equipment rentals $ 1,423,022 $ 1,451,292
Self-storage revenues 110,548 122,248
Self-moving and self-storage product and service sales 199,394 217,798
Property management fees 23,192 22,820
Life insurance premiums 109,572 111,996
Property and casualty insurance premiums 28,337 28,388
Net investment and interest income 58,021 62,110
Other revenue 40,180 32,522
Consolidated revenue $ 1,992,266 $ 2,049,174
(In thousands)
Year Ended March 31,
Self-moving equipment rental revenues decreased $28.3 million in fiscal 2009, compared with fiscal 2008. The
majority of the decrease occurred in the third and fourth quarters of fiscal 2009. Several factors led to the decline in
revenues including a decrease in total rental equipment transactions, foreign currency exchange rates, reduced
revenue per transaction for In-Town moves and the extra day in fiscal 2008. Total rental equipment transactions
decreased less than one percent during the year. Foreign currency exchange rates between the United States and
Canada negatively affected our translated U.S. dollar results during the second half of fiscal 2009. During fiscal
2009 our average revenue per one-way transactions increased while In-Town experienced decreases primarily due to
reduced mileage.
Self-storage revenues decreased $11.7 million in fiscal 2009, compared with fiscal 2008. The deconsolidation of
SAC Holding II, which was effective October 31, 2007, accounted for $11.5 million of the decrease. At Company-
owned locations during fiscal 2009 we saw a decrease in our occupancy rate of approximately 5% compared to
fiscal 2008. The decrease was a result of the addition of approximately seven thousand new rooms into the portfolio
combined with a 2% decrease in rooms rented. We were able to largely offset the occupancy declines with rate
actions.
Sales of self-moving and self-storage products and services decreased $18.4 million in fiscal 2009, compared with
fiscal 2008. The deconsolidation of SAC Holding II accounted for $10.0 million of the decrease. The remaining
decrease was related to reduced sales of hitches, towing accessories and rental support items.
Life Insurance premiums decreased $2.4 million primarily as a result of decreases in Medicare supplement
premiums.
Property and Casualty Insurance premiums decreased $0.1 million due to a decline in U-Haul related business.
23