U-Haul 2009 Annual Report Download - page 103
Download and view the complete annual report
Please find page 103 of the 2009 U-Haul annual report below. You can navigate through the pages in the report by either clicking on the pages listed below, or by using the keyword search tool below to find specific information within the annual report.-
 1
1 -
2
-
3
-
4
-
5
-
6
-
7
-
8
-
9
-
10
-
11
-
12
-
13
-
14
-
15
-
16
-
17
-
18
-
19
-
20
-
21
-
22
-
23
-
24
-
25
-
26
-
27
-
28
-
29
-
30
-
31
-
32
-
33
-
34
-
35
-
36
-
37
-
38
-
39
-
40
-
41
-
42
-
43
-
44
-
45
-
46
-
47
-
48
-
49
-
50
-
51
-
52
-
53
-
54
-
55
-
56
-
57
-
58
-
59
-
60
-
61
-
62
-
63
-
64
-
65
-
66
-
67
-
68
-
69
-
70
-
71
-
72
-
73
-
74
-
75
-
76
-
77
-
78
-
79
-
80
-
81
-
82
-
83
-
84
-
85
-
86
-
87
-
88
-
89
-
90
-
91
-
92
-
 93
93 -
 94
94 -
 95
95 -
 96
96 -
 97
97 -
 98
98 -
 99
99 -
 100
100 -
 101
101 -
 102
102 -
 103
103 -
 104
104 -
 105
105 -
 106
106 -
 107
107 -
 108
108 -
 109
109 -
 110
110 -
 111
111 -
 112
112 -
 113
113 -
114
-
115
-
116
-
117
-
118
-
119
-
120
-
121
-
122
-
123
-
124
-
125
-
126
-
127
-
128
 |
 |

AMERCO AND CONSOLIDATED ENTITIES
NOTES TO CONSOLIDATED FINANCIAL STATEMENTS -- (CONTINUED)
F-48
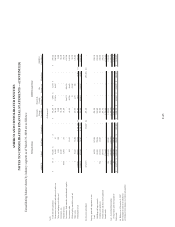
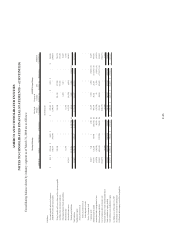
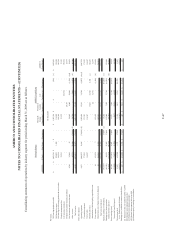
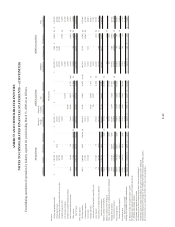
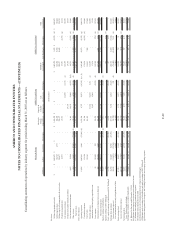
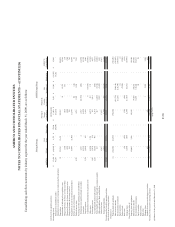
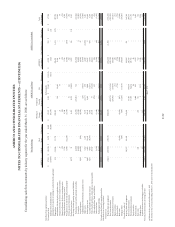
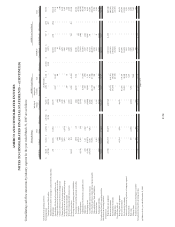
Consolidating statements of operations by industry segment for period ending March 31, 2008 are as follows:
AMERCO U-Haul Real Estate Eliminations
Moving &
Storage
Consolidated
Property &
Casualty
Insurance (a)
Life
Insurance (a) Eliminations
AMERCO
Consolidated SAC Holding II (h) Eliminations
Total
Consolidated
Revenues:
Self-moving equipment rentals -$ 1,451,292$ -$ -$ 1,451,292$ -$ -$ -$ 1,451,292$ 5,846$ (5,846)$ (b) 1,451,292$
Self-storage revenues - 108,965 1,814 - 110,779 - - - 110,779 11,469 - 122,248
Self-moving & self-storage products & service sales - 207,759 - - 207,759 - - - 207,759 10,039 - 217,798
Property management fees - 24,520 - - 24,520 - - - 24,520 - (1,700) (g) 22,820
Life insurance premiums - - - - - - 111,996 - 111,996 - - 111,996
Property and casualty insurance premiums - - - - - 28,388 - - 28,388 - - 28,388
Net investment and interest income 4,498 30,250 158 - 34,906 12,090 20,935 (1,771) (b,d) 66,160 - (4,050) (d) 62,110
Other revenue - 33,645 70,163 (74,834) (b) 28,974 - 4,517 (1,303) (b) 32,188 748 (414) (b) 32,522
Total revenues 4,498 1,856,431 72,135 (74,834) 1,858,230 40,478 137,448 (3,074) 2,033,082 28,102 (12,010) 2,049,174
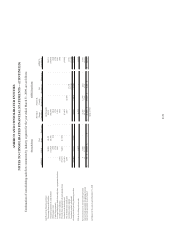
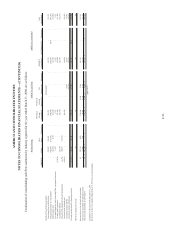
Costs and expenses:
Operating expenses 10,071 1,094,806 9,862 (74,834) (b) 1,039,905 11,999 23,847 (8,075) (b,c,d) 1,067,676 13,510 (1,700) (g) 1,079,486
Commission expenses - 173,791 - - 173,791 - - - 173,791 - (5,846) (b) 167,945
Cost of sales - 115,018 - - 115,018 - - - 115,018 5,192 - 120,210
Benefits and losses - - - - - 19,045 83,408 6,364 (c) 108,817 - - 108,817
Amortization of deferred policy acquisition costs - - - - - 190 12,991 - 13,181 - - 13,181
Lease expense 94 135,401 50 - 135,545 - - (1,200) (b) 134,345 - (414) (b) 133,931
Depreciation, net of (gains) losses on disposals 515 220,696 (476) - 220,735 - - - 220,735 1,474 (327) (e) 221,882
Total costs and expenses 10,680 1,739,712 9,436 (74,834) 1,684,994 31,234 120,246 (2,911) 1,833,563 20,176 (8,287) 1,845,452
Equity in earnings of subsidiaries 15,426 - - 4,086 (f) 19,512 - - (19,512) (f) - - - -
Equity in earnings of SAC Holding II 222 - - - 222 - - - 222 - (222) (f) -
Total - equity in earnings of subsidiaries and SAC Holding II 15,648 - - 4,086 19,734 - - (19,512) 222 - (222) -
Earnings from operations 9,466 116,719 62,699 4,086 192,970 9,244 17,202 (19,675) 199,741 7,926 (3,945) 203,722
Interest income (expense) 88,613 (136,041) (50,668) - (98,096) - - 163 (d) (97,933) (7,537) 4,050 (d) (101,420)
Pretax earnings (loss) 98,079 (19,322) 12,031 4,086 94,874 9,244 17,202 (19,512) 101,808 389 105 102,302
Income tax benefit (expense) (30,498) 9,166 (5,961) - (27,293) (3,335) (3,599) - (34,227) (167) (124) (e) (34,518)
Net earnings (loss) 67,581 (10,156) 6,070 4,086 67,581 5,909 13,603 (19,512) 67,581 222 (19) 67,784
Less: Preferred stock dividends (12,963) - - - (12,963) - - - (12,963) - - (12,963)
Earn
i
ngs
(l
oss
)
ava
il
a
bl
e to common s
h
are
h
o
ld
ers 54,618$ (10,156)$ 6,070$ 4,086$ 54,618$ 5,909$ 13,603$ (19,512)$ 54,618$ 222$ (19)$ 54,821$
(a) Balances for the year ended December 31, 2007
(b) Eliminate intercompany lease income and commission income
(c ) Eliminate intercompany expenses
(d) Eliminate intercompany interest on debt
(e) Eliminate gain on sale of surplus property from U-Haul to SAC Holding II
(f) Eliminate equity in earnings of subsidiaries and equity in earnings of SAC Holding II
(
g
)
E
li
m
i
nate management
f
ees c
h
arge
d
to
SAC
Ho
ldi
ng II an
d
ot
h
er
i
ntercompany operat
i
ng expenses
(h) Activity for the seven months ended October 2007, prior to deconsolidation
(In thousands)
Moving & Storage AMERCO Legal Group AMERCO as Consolidated