U-Haul 2009 Annual Report Download - page 72
Download and view the complete annual report
Please find page 72 of the 2009 U-Haul annual report below. You can navigate through the pages in the report by either clicking on the pages listed below, or by using the keyword search tool below to find specific information within the annual report.-
 1
1 -
2
-
3
-
4
-
5
-
6
-
7
-
8
-
9
-
10
-
11
-
12
-
13
-
14
-
15
-
16
-
17
-
18
-
19
-
20
-
21
-
22
-
23
-
24
-
25
-
26
-
27
-
28
-
29
-
30
-
31
-
32
-
33
-
34
-
35
-
36
-
37
-
38
-
39
-
40
-
41
-
42
-
43
-
44
-
45
-
46
-
47
-
48
-
49
-
50
-
51
-
52
-
53
-
54
-
55
-
56
-
57
-
58
-
59
-
60
-
61
-
 62
62 -
 63
63 -
 64
64 -
 65
65 -
 66
66 -
 67
67 -
 68
68 -
 69
69 -
 70
70 -
 71
71 -
 72
72 -
 73
73 -
 74
74 -
 75
75 -
 76
76 -
 77
77 -
 78
78 -
 79
79 -
 80
80 -
 81
81 -
 82
82 -
83
-
84
-
85
-
86
-
87
-
88
-
89
-
90
-
91
-
92
-
93
-
94
-
95
-
96
-
97
-
98
-
99
-
100
-
101
-
102
-
103
-
104
-
105
-
106
-
107
-
108
-
109
-
110
-
111
-
112
-
113
-
114
-
115
-
116
-
117
-
118
-
119
-
120
-
121
-
122
-
123
-
124
-
125
-
126
-
127
-
128
 |
 |

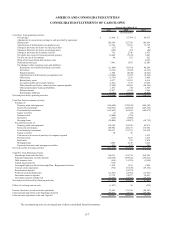
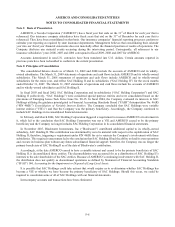
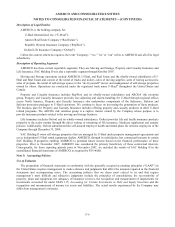
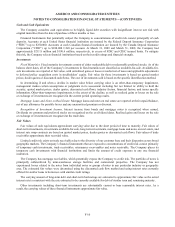
AMERCO AND CONSOLIDATED ENTITIES
NOTES TO CONSOLIDATED FINANCIAL STATEMENTS -- (CONTINUED)
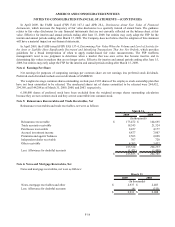
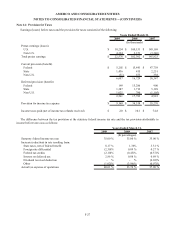
Note 7: Investments
Expected maturities may differ from contractual maturities as borrowers may have the right to call or prepay obligations
with or without call or prepayment penalties.
The Company deposits bonds with insurance regulatory authorities to meet statutory requirements. The adjusted cost of
bonds on deposit with insurance regulatory authorities was $14.4 million at December 31, 2008 and $14.9 million at
December 31, 2007.
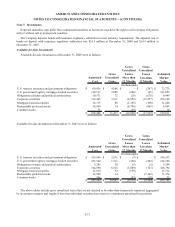
Available-for-Sale Investments
Available-for-sale investments at December 31, 2008 were as follows:
Amortized
Cost
Gross
Unrealized
Gains
Gross
Unrealized
Losses
More than
12 Months
Gross
Unrealized
Losses
Less than
12 Months
Estimated
Market
Value
U.S. treasury securities and government obligations $ 69,936 $ 4,106 $ - $ (267) $ 73,775
U.S. government agency mortgage-backed securities 118,137 3,686 (106) (65) 121,652
Obligations of states and political subdivisions 10,571 72 (18) (676) 9,949
Corporate securities 312,465 3,511 (6,550) (15,257) 294,169
Mortgage-backed securities 12,713 88 (1,395) (198) 11,208
Redeemable preferred stocks 14,509 14 (4,786) (869) 8,868
Common stocks 75 - (65) - 10
$ 538,406 $ 11,477 $ (12,920) $ (17,332) $ 519,631
(In thousands)
Available-for-sale investments at December 31, 2007 were as follows:
Amortized
Cost
Gross
Unrealized
Gains
Gross
Unrealized
Losses
More than
12 Months
Gross
Unrealized
Losses
Less than
12 Months
Estimated
Market
Value
U.S. treasury securities and government obligations $ 143,969 $ 2,571 $ (5) $ - $ 146,535
U.S. government agency mortgage-backed securities 125,569 1,331 (398) (282) 126,220
Obligations of states and political subdivisions 5,281 20 (5) (2) 5,294
Corporate securities 324,890 6,516 (1,889) (721) 328,796
Mortgage-backed securities 15,618 93 (199) - 15,512
Redeemable preferred stocks 12,509 34 - (1,169) 11,374
Common stocks 106 - (43) (10) 53
$
627,942
$
10,565
$
(
2,539
)
$
(
2,184
)
$
633,784
(In thousands)
The above tables include gross unrealized losses that are not deemed to be other-than-temporarily impaired, aggregated
by investment category and length of time that individual securities have been in a continuous unrealized loss position.
F-17