Tesco 2006 Annual Report Download - page 85
Download and view the complete annual report
Please find page 85 of the 2006 Tesco annual report below. You can navigate through the pages in the report by either clicking on the pages listed below, or by using the keyword search tool below to find specific information within the annual report.-
 1
1 -
2
-
3
-
4
-
5
-
6
-
7
-
8
-
9
-
10
-
11
-
12
-
13
-
14
-
15
-
16
-
17
-
18
-
19
-
20
-
21
-
22
-
23
-
24
-
25
-
26
-
27
-
28
-
29
-
30
-
31
-
32
-
33
-
34
-
35
-
36
-
37
-
38
-
39
-
40
-
41
-
42
-
43
-
44
-
45
-
46
-
47
-
48
-
49
-
50
-
51
-
52
-
53
-
54
-
55
-
56
-
57
-
58
-
59
-
60
-
61
-
62
-
63
-
64
-
65
-
66
-
67
-
68
-
69
-
70
-
71
-
72
-
73
-
74
-
 75
75 -
 76
76 -
 77
77 -
 78
78 -
 79
79 -
 80
80 -
 81
81 -
 82
82 -
 83
83 -
 84
84 -
 85
85 -
 86
86 -
 87
87 -
 88
88 -
 89
89 -
 90
90 -
 91
91 -
 92
92 -
 93
93 -
 94
94 -
 95
95 -
96
-
97
-
98
-
99
-
100
-
101
-
102
-
103
-
104
-
105
-
106
-
107
-
108
-
109
-
110
-
111
-
112
-
113
-
114
-
115
-
116
 |
 |

83Tesco plc
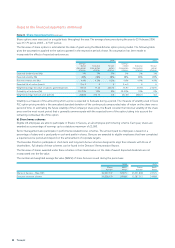
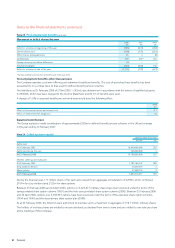
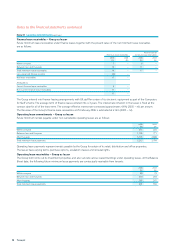
Note 23 Post-employment benefits continued
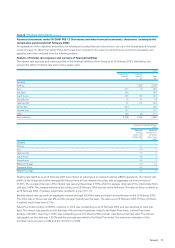
Changes in the fair value of defined benefit pension plan assets are as follows:
2006 2005
£m£m
Opening fair value of plan assets 2,718 1,979
Expected return 209 156
Actuarial gains 309 66
Contributions by employer 270 437*
Actual member contributions 66
Foreign currency translation differences –2
Benefits paid (64) 72
Closing fair value of plan assets 3,448 2,718
*Includes additional contribution of £200m paid in February 2005.
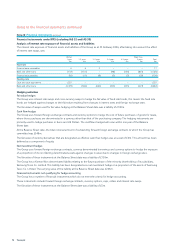
Changes in the present value of defined benefit obligations are as follows:
2006 2005
£m £m
Opening defined benefit obligation (3,453) (2,653)
Service cost (328) (272)
Interest cost (184) (152)
Losses on change of assumptions (727) (282)
Experience losses (24) (14)
Foreign currency translation differences (1) (2)
Benefits paid 64 (72)
Actual member contributions (6) (6)
Closing defined benefit obligation (4,659) (3,453)
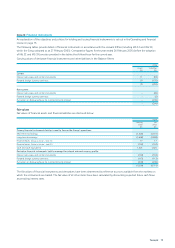
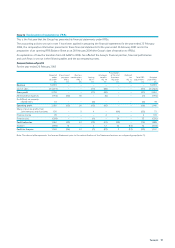
The amounts that have been charged to the Income Statement and Statement of Recognised Income and Expense for the year
ended 25 February 2006 are set out below:
2006 2005
£m £m
Analysis of the amount charged to Operating profit:
Current service cost 328 272
Total charge to Operating profit 328 272
Analysis of the amount credited/(charged) to Finance income:
Expected return on pension schemes’ assets 209 156
Interest on pension schemes’ liabilities (184) (152)
Net pension financeincome (note 5) 25 4
Total charge to the Income Statement 303 268
2006 2005
£m £m
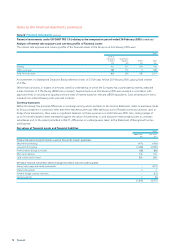
Analysis of the amount recognised in the Statement of Recognised Income and Expense:
Actual return less expected return on pension schemes’ assets 309 66
Experience gains and losses arising on the schemes’ liabilities (24) (14)
Changes in assumptions underlying the present value of the schemes’ liabilities (727) (282)
Total actuarial loss recognised in the Statement of Recognised Income and Expense (442) (230)