Tesco 2006 Annual Report Download - page 55
Download and view the complete annual report
Please find page 55 of the 2006 Tesco annual report below. You can navigate through the pages in the report by either clicking on the pages listed below, or by using the keyword search tool below to find specific information within the annual report.-
 1
1 -
2
-
3
-
4
-
5
-
6
-
7
-
8
-
9
-
10
-
11
-
12
-
13
-
14
-
15
-
16
-
17
-
18
-
19
-
20
-
21
-
22
-
23
-
24
-
25
-
26
-
27
-
28
-
29
-
30
-
31
-
32
-
33
-
34
-
35
-
36
-
37
-
38
-
39
-
40
-
41
-
42
-
43
-
44
-
 45
45 -
 46
46 -
 47
47 -
 48
48 -
 49
49 -
 50
50 -
 51
51 -
 52
52 -
 53
53 -
 54
54 -
 55
55 -
 56
56 -
 57
57 -
 58
58 -
 59
59 -
 60
60 -
 61
61 -
 62
62 -
 63
63 -
 64
64 -
 65
65 -
66
-
67
-
68
-
69
-
70
-
71
-
72
-
73
-
74
-
75
-
76
-
77
-
78
-
79
-
80
-
81
-
82
-
83
-
84
-
85
-
86
-
87
-
88
-
89
-
90
-
91
-
92
-
93
-
94
-
95
-
96
-
97
-
98
-
99
-
100
-
101
-
102
-
103
-
104
-
105
-
106
-
107
-
108
-
109
-
110
-
111
-
112
-
113
-
114
-
115
-
116
 |
 |

53Tesco plc
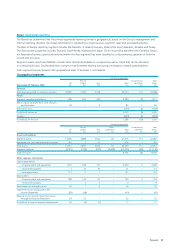
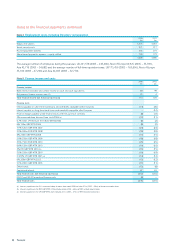
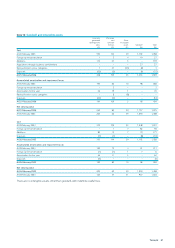
Note 2 Segmental reporting
The Board has determined that the primary segmental reporting format is geographical, based on the Group’s management and
internal reporting structure. Secondary information is reported by a single business segment, retail and associated activities.
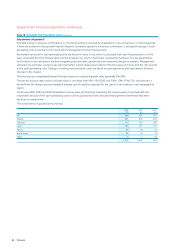
The Rest of Europe reporting segment includes the Republic of Ireland, Hungary, Poland, the Czech Republic, Slovakia and Turkey.
The Asia reporting segment includes Thailand, South Korea, Malaysia and Japan. Given its pending transfer to the Carrefour Group,
our Taiwanese business (previously included within the Asia segment) has been classified as a discontinuing operation in both the
current and prior year.
Segment results, assets and liabilities include items directly attributable to a segment as well as those that can be allocated
on a reasonable basis. Unallocated items comprise mainly interest-bearing borrowings and taxation related assets/liabilities.
Inter-segment turnover between the geographical areas of business is not material.
Geographical segments
Continuing operations
Rest of Discontinuing Total
UK Europe Asia Total operation Group
Year ended 25 February 2006 £m £m £m £m £m £m
Revenue
Sales (excluding VAT) to external customers 29,990 5,095 4,369 39,454 134 39,588
Result
Segment operating profit/(loss) 1,788 263 229 2,280 (9) 2,271
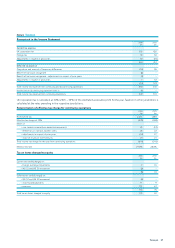
Share of post-tax profit from Joint ventures
and Associates 78 – 4 82 1 83
Net finance costs (127) (1) (128)
Profit/(loss) before tax 2,235 (9) 2,226
Taxation (649) (1) (650)
Profit/(loss) for the year 1,586 (10) 1,576
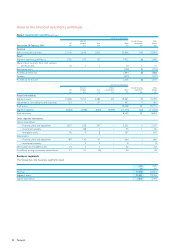
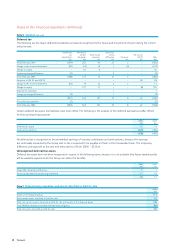
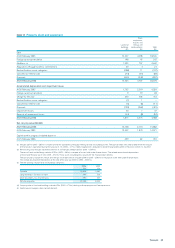
Continuing operations
Restof Other/ Discontinuing Total
UK Europe Asia unallocated Total operation Group
£m £m £m £m £m £m £m
Assets and liabilities
Segment assets 14,906 3,888 3,012 167 21,973 114 22,087
Investments in Joint ventures and Associates 461 2 13 – 476 – 476
Total assets 15,367 3,890 3,025 167 22,449 114 22,563
Segment liabilities (5,025) (708) (692) (6,608) (13,033) (86) (13,119)
Total net assets 9,416 28 9,444
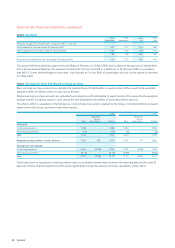
Other segment information
Capital expenditure:
–Property, plant and equipment 1,673 549 417 – 2,639 3 2,642
–Investment property 1 10 10 – 21 – 21
–Intangible assets 121 11 7 – 139 – 139
Depreciation:
–Property, plant and equipment 508 146 95 – 749 4 753
–Investment property – 4 5 – 9 – 9
Amortisation of intangible assets 63 7 6 – 76 – 76
Impairment losses recognised in the
Income Statement (29) (18) – – (47) – (47)
Reversal of prior period impairment losses
through the Income Statement 29 23 – – 52 – 52
Profit/(loss) arising on property-related items 90 (6) (7) – 77 – 77