Tesco 2006 Annual Report Download - page 47
Download and view the complete annual report
Please find page 47 of the 2006 Tesco annual report below. You can navigate through the pages in the report by either clicking on the pages listed below, or by using the keyword search tool below to find specific information within the annual report.-
 1
1 -
2
-
3
-
4
-
5
-
6
-
7
-
8
-
9
-
10
-
11
-
12
-
13
-
14
-
15
-
16
-
17
-
18
-
19
-
20
-
21
-
22
-
23
-
24
-
25
-
26
-
27
-
28
-
29
-
30
-
31
-
32
-
33
-
34
-
35
-
36
-
 37
37 -
 38
38 -
 39
39 -
 40
40 -
 41
41 -
 42
42 -
 43
43 -
 44
44 -
 45
45 -
 46
46 -
 47
47 -
 48
48 -
 49
49 -
 50
50 -
 51
51 -
 52
52 -
 53
53 -
 54
54 -
 55
55 -
 56
56 -
 57
57 -
58
-
59
-
60
-
61
-
62
-
63
-
64
-
65
-
66
-
67
-
68
-
69
-
70
-
71
-
72
-
73
-
74
-
75
-
76
-
77
-
78
-
79
-
80
-
81
-
82
-
83
-
84
-
85
-
86
-
87
-
88
-
89
-
90
-
91
-
92
-
93
-
94
-
95
-
96
-
97
-
98
-
99
-
100
-
101
-
102
-
103
-
104
-
105
-
106
-
107
-
108
-
109
-
110
-
111
-
112
-
113
-
114
-
115
-
116
 |
 |

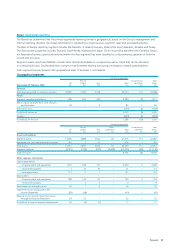
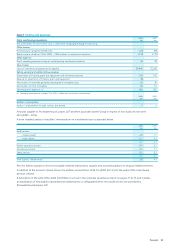
45Tesco plc
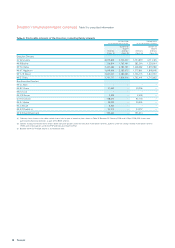
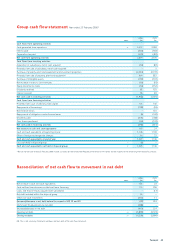
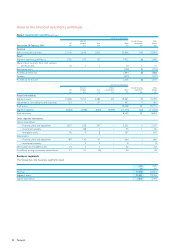
Reconciliation of net cash flow to movement in net debt
Group cash flow statement Year ended 25 February 2006*
2006 2005
notes £m £m
Cash flows from operating activities
Cash generated from operations 28 3,412 3,009
Interest paid (364) (350)
Corporation tax paid (429) (483)
Net cash from operating activities 2,619 2,176
Cash flows from investing activities
Acquisition of subsidiaries, net of cash acquired (54) (81)
Proceeds from sale of subsidiary, net of cash acquired –5
Purchase of property, plant and equipment and investment properties (2,561) (2,197)
Proceeds from sale of property, plant and equipment 664 823
Purchase of intangible assets (139) (107)
Net increase in loans to Joint ventures (16) (10)
Equity investments made (34) (152)
Dividends received 82 135
Interest received 96 83
Net cash used in investing activities (1,962) (1,501)
Cash flows from financing activities
Proceeds from issue of ordinary share capital 123 146
Repayments of borrowings (109) (18)
New financeleases – 161
Repayments of obligations under finance leases (6) (349)
Dividends paid (441) (448)
Own shares purchased (59) (143)
Net cash used in financing activities (492) (651)
Net increasein cash and cash equivalents 165 24
Cash and cash equivalents at beginning of year 1,146 1,100
Effect of foreign exchange rate changes 16 22
Cash and cash equivalents at end of year 1,327 1,146
Less cash held in disposal group 7(2) –
Cash and cash equivalents not held in disposal group 17 1,325 1,146
* Results for the year ended 25 February 2006 include 52 weeks for the UK and the Republic of Ireland and 14 months for the majority of the remaining International businesses.
2006 2005
notes £m £m
Net increasein cash and cash equivalents 165 24
Cash outflow from decrease in debt and lease financing 115 206
Loans and finance leases acquired with subsidiaries – (17)
Net debtincluded within the disposal group 55 –
Other non-cash movements (357) 11
(Increase)/decrease in net debt before the impact of IAS 32 and 39 (22) 224
IAS 32 and 39 adjustments tonet debt(588) –
(Increase)/decrease in net debt (610) 224
Opening net debt 29 (3,899) (4,123)
Closing net debt 29 (4,509) (3,899)
NB. This is not a primary statement and does not form part of the cash flow statement.