Tesco 2006 Annual Report Download - page 64
Download and view the complete annual report
Please find page 64 of the 2006 Tesco annual report below. You can navigate through the pages in the report by either clicking on the pages listed below, or by using the keyword search tool below to find specific information within the annual report.-
 1
1 -
2
-
3
-
4
-
5
-
6
-
7
-
8
-
9
-
10
-
11
-
12
-
13
-
14
-
15
-
16
-
17
-
18
-
19
-
20
-
21
-
22
-
23
-
24
-
25
-
26
-
27
-
28
-
29
-
30
-
31
-
32
-
33
-
34
-
35
-
36
-
37
-
38
-
39
-
40
-
41
-
42
-
43
-
44
-
45
-
46
-
47
-
48
-
49
-
50
-
51
-
52
-
53
-
 54
54 -
 55
55 -
 56
56 -
 57
57 -
 58
58 -
 59
59 -
 60
60 -
 61
61 -
 62
62 -
 63
63 -
 64
64 -
 65
65 -
 66
66 -
 67
67 -
 68
68 -
 69
69 -
 70
70 -
 71
71 -
 72
72 -
 73
73 -
 74
74 -
75
-
76
-
77
-
78
-
79
-
80
-
81
-
82
-
83
-
84
-
85
-
86
-
87
-
88
-
89
-
90
-
91
-
92
-
93
-
94
-
95
-
96
-
97
-
98
-
99
-
100
-
101
-
102
-
103
-
104
-
105
-
106
-
107
-
108
-
109
-
110
-
111
-
112
-
113
-
114
-
115
-
116
 |
 |

62 Tesco plc
Notes to the financial statements continued
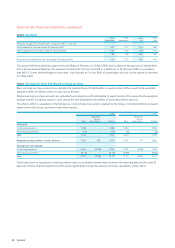
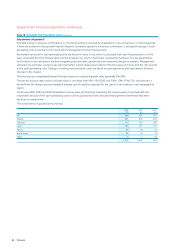
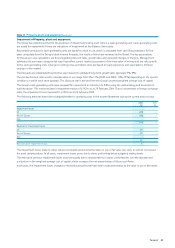
Note 10 Goodwill and intangible assets continued
Impairment of goodwill
Goodwill arising on business combinations is not amortised but is reviewed for impairment on an annual basis or more frequently
if there are indications that goodwill may be impaired. Goodwill acquired in a business combination is allocated to groups of cash-
generating units according to the level at which management monitor that goodwill.
Recoverable amounts for cash-generating units are based on value in use, which is calculated from cash flow projections for five
years using data from the Group’s latest internal forecasts, the results of which are reviewed by the Board. The key assumptions
for the value in use calculations are those regarding discount rates, growth rates and expected changes in margins. Management
estimates discount rates using pre-tax rates that reflect current market assessment of the time value of money and the risks specific
to the cash-generating units. Changes in selling prices and direct costs are based on past experience and expectations of future
changes in the market.
The forecasts are extrapolated beyond five years based on estimated growth rates (generally 3%-4%).
The pre-tax discount rates used to calculate value in use range from 9%-11% (2005 and 2004: 10%-13%). This discount rate is
derived from the Group’s post-tax weighted average cost of capital as adjusted for the specific risks relating to each geographical
region.
In February 2006, 2005 and 2004 impairment reviews were performed by comparing the carrying value of goodwill with the
recoverable amount of the cash-generating units to which goodwill has been allocated. Management determined that there
has been no impairment.
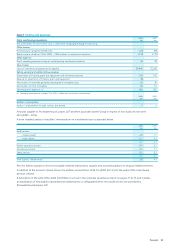
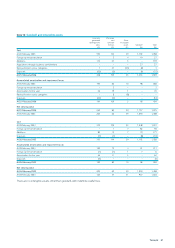
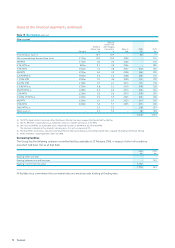
The components of goodwill are as follows:
2006 2005 2004
£m £m £m
UK 466 463 414
Poland 331 323 252
Thailand 115 107 109
Japan 133 135 121
Turkey 55 49 43
South Korea 32 10 8
Other 5710
1,137 1,094 957