Tesco 2006 Annual Report Download - page 104
Download and view the complete annual report
Please find page 104 of the 2006 Tesco annual report below. You can navigate through the pages in the report by either clicking on the pages listed below, or by using the keyword search tool below to find specific information within the annual report.-
 1
1 -
2
-
3
-
4
-
5
-
6
-
7
-
8
-
9
-
10
-
11
-
12
-
13
-
14
-
15
-
16
-
17
-
18
-
19
-
20
-
21
-
22
-
23
-
24
-
25
-
26
-
27
-
28
-
29
-
30
-
31
-
32
-
33
-
34
-
35
-
36
-
37
-
38
-
39
-
40
-
41
-
42
-
43
-
44
-
45
-
46
-
47
-
48
-
49
-
50
-
51
-
52
-
53
-
54
-
55
-
56
-
57
-
58
-
59
-
60
-
61
-
62
-
63
-
64
-
65
-
66
-
67
-
68
-
69
-
70
-
71
-
72
-
73
-
74
-
75
-
76
-
77
-
78
-
79
-
80
-
81
-
82
-
83
-
84
-
85
-
86
-
87
-
88
-
89
-
90
-
91
-
92
-
93
-
 94
94 -
 95
95 -
 96
96 -
 97
97 -
 98
98 -
 99
99 -
 100
100 -
 101
101 -
 102
102 -
 103
103 -
 104
104 -
 105
105 -
 106
106 -
 107
107 -
 108
108 -
 109
109 -
 110
110 -
 111
111 -
 112
112 -
 113
113 -
 114
114 -
115
-
116
 |
 |

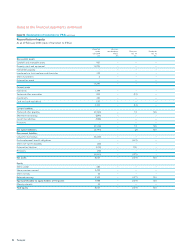
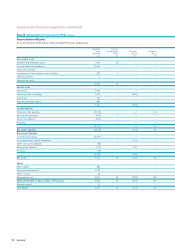
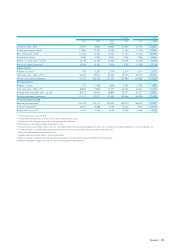
102 Tesco plc
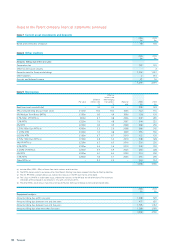
Five year record
UK GAAP IFRS
2002 2003 2004 2005 2005120062
53 wks
Financial statistics
Group sales (£m) 25,401 28,280 33,557 37,070 36,957 43,137
Revenue excluding VAT (£m)
UK 19,821 21,309 24,760 27,146 27,146 29,990
Rest of Europe 2,181 2,664 3,385 3,818 3,818 5,095
Asia 1,398 2,031 2,669 3,010 2,902 4,369
23,400 26,004 30,814 33,974 33,866 39,454
Operating profit3(£m)
UK 1,215 1,289 1,486 1,666 1,556 1,788
Rest of Europe 90 134 171 249 243 263
Asia 17 69 121 149 153 229
Total Group 1,322 1,492 1,778 2,064 1,952 2,280
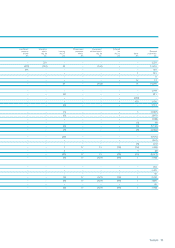
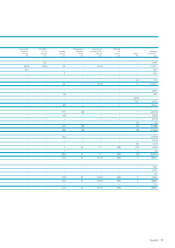
Operating profit margin3
UK 6.1% 6.0% 6.0% 6.1% 5.7% 6.0%
Rest of Europe 4.1% 5.0% 5.1% 6.5% 6.4% 5.2%
Asia 1.2% 3.4% 4.5% 5.0% 5.3% 5.2%
Total Group 5.6% 5.7% 5.8% 6.1% 5.8% 5.8%
Goodwill amortisation (£m) (10) (23) (54) (67) – –
Share of results of Joint ventures and Associates4(£m) 22 42 59 69 74 82
Net finance costs4(£m) (140) (166) (209) (136) (132) (127)
Profit before tax (£m) 1,194 1,345 1,574 1,930 1,894 2,235
Taxation4(£m) (364) (399) (472) (561) (541) (649)
Minorityinterests (£m) – – (2) (3) (3) (6)
Loss for the period from discontinuing operation5(£m) – – – – (6) (10)
Profit for the financial year attributable to
equity holders of the parent (£m) 830 946 1,100 1,366 1,344 1,570
Underlying profit – UK GAAP6(£m) 1,221 1,401 1,708 2,029 N/a N/a
Underlying profit – IFRS6(£m) N/a N/a N/a N/a 1,925 2,277
1The 2005 IFRS financial statistics have been restated to remove the Taiwanese business which is held for sale.
2Results for the year ended 25 February 2006 include 52 weeks for the UK and ROI and 14 months for International.
3Operating profit includes integration costs and profit/(loss) arising on sale of fixed assets. Operating margin is based upon revenue exclusive of VAT.
4Share of results of Joint ventures and Associates is stated net of the interest and tax of the Group’s JVs and Associates. The Group’s charges for interest and tax have been
reduced by these amounts.
5Consists of the net result of the Taiwanese business which is held for sale.
6UK GAAP underlying profit excluded net profit/(loss) on disposal of fixed assets, integration costs and goodwill amortisation. IFRS underlying profit excludes IAS 32 and IAS 39
and the IAS 19 charge for defined benefit pension schemes, which is replaced by the normal cash contributions. For the years 2002 to 2005 the above information is
presented under UK GAAP as previously published. If IFRSs had been applicable for these years the main adjustments would have been similar to those in Note 32.