Tesco 2006 Annual Report Download - page 6
Download and view the complete annual report
Please find page 6 of the 2006 Tesco annual report below. You can navigate through the pages in the report by either clicking on the pages listed below, or by using the keyword search tool below to find specific information within the annual report.-
 1
1 -
 2
2 -
 3
3 -
 4
4 -
 5
5 -
 6
6 -
 7
7 -
 8
8 -
 9
9 -
 10
10 -
 11
11 -
 12
12 -
 13
13 -
 14
14 -
 15
15 -
 16
16 -
 17
17 -
18
-
19
-
20
-
21
-
22
-
23
-
24
-
25
-
26
-
27
-
28
-
29
-
30
-
31
-
32
-
33
-
34
-
35
-
36
-
37
-
38
-
39
-
40
-
41
-
42
-
43
-
44
-
45
-
46
-
47
-
48
-
49
-
50
-
51
-
52
-
53
-
54
-
55
-
56
-
57
-
58
-
59
-
60
-
61
-
62
-
63
-
64
-
65
-
66
-
67
-
68
-
69
-
70
-
71
-
72
-
73
-
74
-
75
-
76
-
77
-
78
-
79
-
80
-
81
-
82
-
83
-
84
-
85
-
86
-
87
-
88
-
89
-
90
-
91
-
92
-
93
-
94
-
95
-
96
-
97
-
98
-
99
-
100
-
101
-
102
-
103
-
104
-
105
-
106
-
107
-
108
-
109
-
110
-
111
-
112
-
113
-
114
-
115
-
116
 |
 |

4 Tesco plc
4
One in seven
customers buy
from our clothing
department
each week.
4
We sell
three million
mugs a year.
Operating and financial review continued
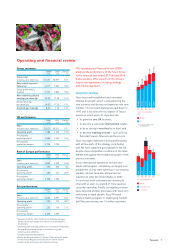
Net finance costs were £127m (last year £132m), giving
interest cover of 18.6 times (last year 15.3 times). Tax has been
charged at an effective rate of 29.0% (last year 28.6%).
New underlying diluted earnings per share increased
by 14.1% to 20.06p (last year 17.58p).
Dividend The Board has proposed a final dividend of 6.10p
per share (last year 5.27p). This represents an increase of
15.7% and brings the full year dividend per share to 8.63p,
up 14.2% on last year. We have built dividend cover to
comfortable levels and this increase in the final dividend is
in line with earnings per share growth. We also intend to grow
future dividends broadly in line with underlying earnings per
share, instead of building dividend cover whilst delivering
strong dividend growth, which has been our dividend policy
for the last three years.
The final dividend will be paid on 14 July 2006 toshareholders
on the Register of Members at the close of business on 5 May
2006. Shareholders will continue to have the right to receive the
dividend in the form of fully paid ordinary shares instead of cash.
The first day of dealing in the new shares will be 14 July 2006.
Cash flow and Balance Sheet The Group generated net cash
of £165m during the year, benefiting from strong cash flow
from operating activities of £3.4bn and the net proceeds of
£346m from our property joint venture with Consensus. Within
this, £239m of cash was released from working capital, which
was £199m lower than lastyear. This was due mainly to a
smaller rise in trade creditors than last year (last year’s increase
was exceptionally large and the change in the International
year end reduced trade creditors), higher non-food stocks
(linked to global sourcing) and increased debtors (resulting
from advance rent on new leasehold stores in Korea).
Net borrowings, at £4.5bn at year end, were higher than last
year, primarily due to IAS 32 and IAS 39. Excluding the impact
of IAS 32 and IAS 39, net debtwas broadly unchanged at
£3.9bn. Gearing was 48%.
Group capital expenditure during the year (excluding
acquisitions) was £2.8bn (last year £2.4bn). This included
£0.1bn of capital spent during the extra trading weeks in early
2006 for International. UK capital expenditure was £1.8bn (last
year £1.7bn), including £760m on new stores and £404m on
extensions and refits. Total International capital expenditure
rose to £1.0bn (lastyear £0.7bn) reflecting the extra trading
weeks, plus our enlarged new storeopening programme and
comprising £0.4bn in Asia and £0.6bn in Europe.
Weexpect Group capital expenditure to be around £3.0bn
this year, reflecting a stable level of investment in the existing
business, together with the £250m of capital which we
announced in February would be invested in establishing
our operations in the United States.
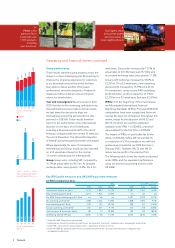
Return on capital employed (ROCE) In January 2004, we
said that we had an aspiration to increase our 2002/03 post tax
ROCE of 10.2% by up to 200 basis points over five years on
then current plans. The excellent progress the business has
made since then means that ROCE has exceeded our target
of 12.2% this year – two years early.
On an equivalent (pre-IFRS) basis, ROCE increased by 260
basis points to 12.8% in just three years. This represents an
increase of almost 70% over just three years in the economic
profit made by the business (the extent to which return on
capital exceeds the estimated weighted cost of capital for
the Group). Operational improvement in the business has
delivered almost three-quarters of this increase in returns
and the balance reflects the benefits of our property funding
initiatives with Topland and Consensus.
We remain committed to delivering rising returns for
shareholders and to demonstrate this we have decided to set
anew ROCE target for the Group. We aim to improve ROCE by
a further 200 basis points from a combination of operational
improvement and more efficient use of the property elements
of our Balance Sheet. All four parts of our strategy will
contribute to this improvement.
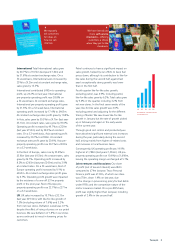
Total shareholder return Total shareholder return (TSR),
which is measured as the percentage change in the share
price, plus the dividend paid, has increased by 45.8% over
the lastfive years, compared to an increase in the average
for FTSE 100 companies of 16.3%. Over the last three years,
Tesco’s TSR has grown 126.0% compared with the FTSE 100
average of 80.0%. During the last year, the return for Tesco
was 11.5% compared with the FTSE 100 average of 21.0%,
which was buoyed by the strong performance of oil, gas
and mining stocks.