Tesco 2006 Annual Report Download - page 57
Download and view the complete annual report
Please find page 57 of the 2006 Tesco annual report below. You can navigate through the pages in the report by either clicking on the pages listed below, or by using the keyword search tool below to find specific information within the annual report.-
 1
1 -
2
-
3
-
4
-
5
-
6
-
7
-
8
-
9
-
10
-
11
-
12
-
13
-
14
-
15
-
16
-
17
-
18
-
19
-
20
-
21
-
22
-
23
-
24
-
25
-
26
-
27
-
28
-
29
-
30
-
31
-
32
-
33
-
34
-
35
-
36
-
37
-
38
-
39
-
40
-
41
-
42
-
43
-
44
-
45
-
46
-
 47
47 -
 48
48 -
 49
49 -
 50
50 -
 51
51 -
 52
52 -
 53
53 -
 54
54 -
 55
55 -
 56
56 -
 57
57 -
 58
58 -
 59
59 -
 60
60 -
 61
61 -
 62
62 -
 63
63 -
 64
64 -
 65
65 -
 66
66 -
 67
67 -
68
-
69
-
70
-
71
-
72
-
73
-
74
-
75
-
76
-
77
-
78
-
79
-
80
-
81
-
82
-
83
-
84
-
85
-
86
-
87
-
88
-
89
-
90
-
91
-
92
-
93
-
94
-
95
-
96
-
97
-
98
-
99
-
100
-
101
-
102
-
103
-
104
-
105
-
106
-
107
-
108
-
109
-
110
-
111
-
112
-
113
-
114
-
115
-
116
 |
 |

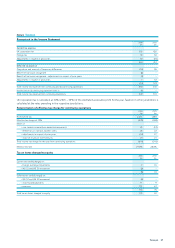
55Tesco plc
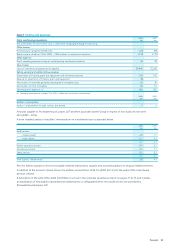
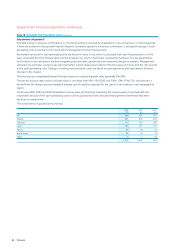
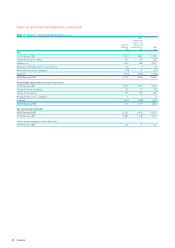
Note 3 Income and expenses
2006 2005
From continuing operations £m £m
The profit before tax and finance costs is stated after charging/(crediting) the following:
Other income
Profit arising on property-related items (77) (49)
Rental income, of which £140m (2005 – £93m) relates to investment properties (175) (119)
Other expenses
Direct operating expenses arising on rental earning investment properties 46 28
Cost of sales
Costs of inventories recognised as an expense 29,640 25,268
Selling, general and administrative expenses
Depreciation of Property, plant and equipment and Investment property 758 672
Reversal of impairment of Property, plant and equipment (5) –
Amortisation of internally-generated development intangible assets 56 46
Amortisation of other intangibles 20 16
Operating lease expenses (a) 360 283
(a) Operating lease expenses include £71m (2005 – £69m) for hire of plant and machinery.
2006 2005
£m £m
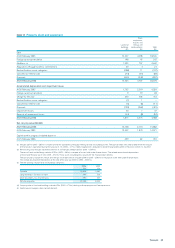
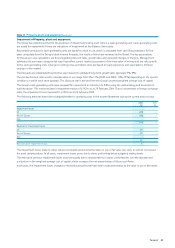
Auditors’ remuneration
Auditors’ remuneration for audit services (see below) 32
Amounts payable to PricewaterhouseCoopers LLP and their associates by the Group in respect of non-audit services were
£3m (2005 – £2m).
Amoredetailed analysis of auditors’ remuneration on a worldwide basis is provided below:
2006 2005
£m £m
Audit services:
– statutory audit 2.0 1.7
–audit-related 0.7 0.4
2.7 2.1
Further assurance services 0.4 0.7
Tax advisory services 2.5 1.1
Other services 0.2 0.2
3.1 2.0
Total auditors’ remuneration 5.8 4.1
Fees for further assurance services principally comprise transactions support and accounting advice on treasury-related schemes.
In addition tothe amounts shown above, the auditors received fees of £0.1m (2005 £0.1m) for the audit of the main Group
pension scheme.
A description of the work of the Audit Committee is set out in the corporate governance report on pages 21 to 23 and includes
an explanation of how auditor objectivity and independence is safeguarded when non-audit services are provided by
PricewaterhouseCoopers LLP.