Tesco 2006 Annual Report Download - page 84
Download and view the complete annual report
Please find page 84 of the 2006 Tesco annual report below. You can navigate through the pages in the report by either clicking on the pages listed below, or by using the keyword search tool below to find specific information within the annual report.-
 1
1 -
2
-
3
-
4
-
5
-
6
-
7
-
8
-
9
-
10
-
11
-
12
-
13
-
14
-
15
-
16
-
17
-
18
-
19
-
20
-
21
-
22
-
23
-
24
-
25
-
26
-
27
-
28
-
29
-
30
-
31
-
32
-
33
-
34
-
35
-
36
-
37
-
38
-
39
-
40
-
41
-
42
-
43
-
44
-
45
-
46
-
47
-
48
-
49
-
50
-
51
-
52
-
53
-
54
-
55
-
56
-
57
-
58
-
59
-
60
-
61
-
62
-
63
-
64
-
65
-
66
-
67
-
68
-
69
-
70
-
71
-
72
-
73
-
 74
74 -
 75
75 -
 76
76 -
 77
77 -
 78
78 -
 79
79 -
 80
80 -
 81
81 -
 82
82 -
 83
83 -
 84
84 -
 85
85 -
 86
86 -
 87
87 -
 88
88 -
 89
89 -
 90
90 -
 91
91 -
 92
92 -
 93
93 -
 94
94 -
95
-
96
-
97
-
98
-
99
-
100
-
101
-
102
-
103
-
104
-
105
-
106
-
107
-
108
-
109
-
110
-
111
-
112
-
113
-
114
-
115
-
116
 |
 |

82 Tesco plc
Notes to the financial statements continued
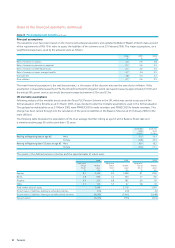
Note 23 Post-employment benefits continued
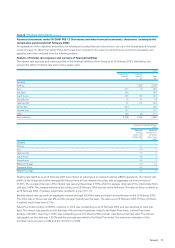
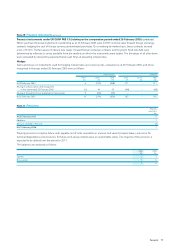
Principal assumptions
The valuations used have been based on the most recent actuarial valuations and updated by Watson Wyatt Limited to take account
of the requirements of IAS 19 in order to assess the liabilities of the schemes as at 25 February 2006. The major assumptions, on a
weighted average basis, used by the actuaries were as follows:
2006 2005 2004
%%%
Rate of increase in salaries 4.0 3.9 3.8
Rate of increase in pensions in payment 2.7 2.6 2.5
Rate of increase in deferred pensions 2.7 2.6 2.5
Rate of increase in career average benefits 2.7 2.6 2.5
Discount rate 4.8 5.4 5.7
Price inflation 2.7 2.6 2.5
The main financial assumption is the real discount rate, i.e. the excess of the discount rate over the rate of price inflation. If this
assumption increased/decreased by 0.1%, the UK defined benefit obligation would decrease/increase by approximately £110m and
the annual UK current service cost would decrease/increase by between £13m and £15m.
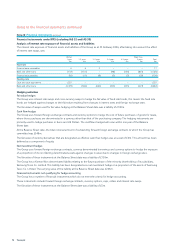
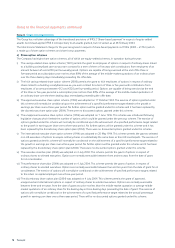
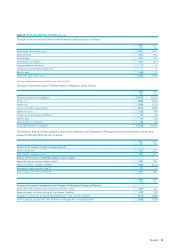
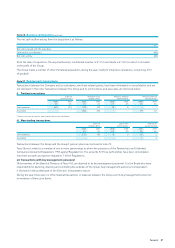
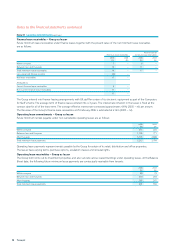
UK mortality assumptions
Following analysis of the mortality trends under the Tesco PLC Pension Scheme in the UK, which was carried out as part of the
formal valuation of the Scheme as at 31 March 2005, it was decided to alter the mortality assumptions used in the formal valuation.
The updated mortality tables as at 31 March 2005 were PMA92COO for male members and PFA92COO for female members. This
change has been carried through into the calculation of the pension liabilities in the Balance Sheet as at 25 February 2006 for the
main UK fund.
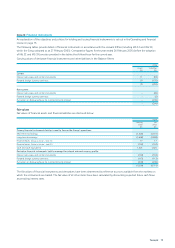
The following table illustrates the expectation of life of an average member retiring at age 65 at the Balance Sheet date and
amember reaching age 65 at the same date +25 years.
At 25 Feb At 26 Feb
2006 2005
in years in years
Retiring at Reporting dateat age 65: Male 17.5 16.4
Female 21.8 20.3
Retiring at Reporting date +25 years at age 65: Male 18.4 18.2
Female 23.0 21.1
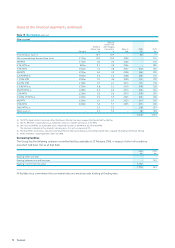
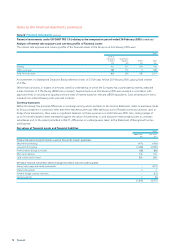
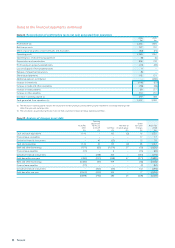
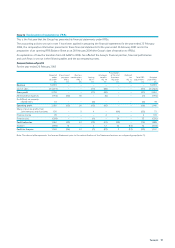
The assets in the defined pension schemes and the expected rates of return were:
2006 2005 2004
Long term Long term Long term
rateof Market rate of Market rate of Market
return value return value return value
%£m %£m %£m
Equities 8.1 2,416 8.2 1,908 8.1 1,399
Bonds 4.8 656 5.4 560 5.7 445
Property 6.4 253 6.8 183 6.9 92
Other 3.7 123 3.5 67 3.8 43
Total market value of assets 3,448 2,718 1,979
Present value of liabilities relating to unfunded schemes (17) (12) (5)
Present value of liabilities relating to partially funded schemes (4,642) (3,441) (2,648)
Pension deficit (1,211) (735) (674)