Tesco 2006 Annual Report Download - page 82
Download and view the complete annual report
Please find page 82 of the 2006 Tesco annual report below. You can navigate through the pages in the report by either clicking on the pages listed below, or by using the keyword search tool below to find specific information within the annual report.-
 1
1 -
2
-
3
-
4
-
5
-
6
-
7
-
8
-
9
-
10
-
11
-
12
-
13
-
14
-
15
-
16
-
17
-
18
-
19
-
20
-
21
-
22
-
23
-
24
-
25
-
26
-
27
-
28
-
29
-
30
-
31
-
32
-
33
-
34
-
35
-
36
-
37
-
38
-
39
-
40
-
41
-
42
-
43
-
44
-
45
-
46
-
47
-
48
-
49
-
50
-
51
-
52
-
53
-
54
-
55
-
56
-
57
-
58
-
59
-
60
-
61
-
62
-
63
-
64
-
65
-
66
-
67
-
68
-
69
-
70
-
71
-
 72
72 -
 73
73 -
 74
74 -
 75
75 -
 76
76 -
 77
77 -
 78
78 -
 79
79 -
 80
80 -
 81
81 -
 82
82 -
 83
83 -
 84
84 -
 85
85 -
 86
86 -
 87
87 -
 88
88 -
 89
89 -
 90
90 -
 91
91 -
 92
92 -
93
-
94
-
95
-
96
-
97
-
98
-
99
-
100
-
101
-
102
-
103
-
104
-
105
-
106
-
107
-
108
-
109
-
110
-
111
-
112
-
113
-
114
-
115
-
116
 |
 |

80 Tesco plc
Notes to the financial statements continued
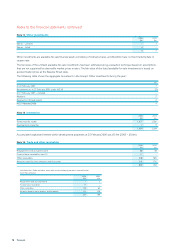
Note 22 Share-based payments continued
Share options were exercised on a regular basis throughout the year. The average share price during the year to 25 February 2006
was 317.79 pence (2005 – 277.87 pence).
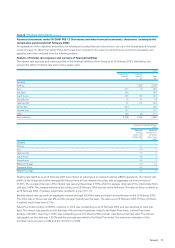
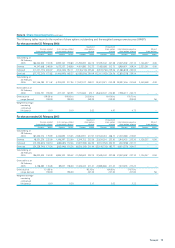
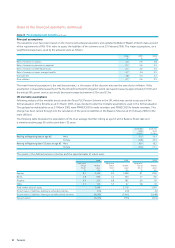
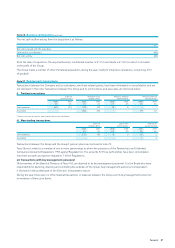
The fair value of share options is estimated at the date of grant using the Black-Scholes option pricing model. The following table
gives the assumptions applied to the options granted in the respective periods shown. No assumption has been made to
incorporate the effects of expected early exercise.
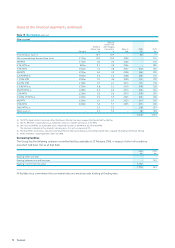
2006 2005
Savings- Savings-
related Executive Nil cost related Executive Nil cost
share option share option option share option share option option
schemes schemes schemes schemes schemes schemes
Expected dividend yield (%) 3% 3% 3% 3% 3% 3%
Expected volatility (%) 28% 28% 28% 28% 28% 28%
Risk-free interest rate (%) 4.4% 4.2% 4.2% 4.6% 4.9% 4.9%
Expected life of option (years) 3 or 5 6 6 3 or 5 6 6
Weighted average fair value of options granted (pence) 93.55 77.24 256.75 73.97 65.93 210.91
Probability of forfeiture (%) 20-25% 10% 0% 20-25% 10% 0%
Weighted average exercise price (pence) 248.00 312.75 0.0 232.00 288.25 0.0
Volatility is a measure of the amount by which a price is expected to fluctuate during a period. The measure of volatility used in Tesco
PLC option pricing models is the annualised standard deviation of the continuously compounded rates of return on the share over a
period of time. In estimating the future volatility of the Company’s share price, the Board consider the historical volatility of the share
price over the most recent period that is generally commensurate with the expected term of the option, taking into account the
remaining contractual life of the option.
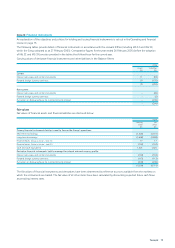
b) Share bonus schemes
Eligible UK employees are able to participate in Shares in Success, an all-employee profit sharing scheme. Each year, shares are
awarded as a percentage of earnings up to a statutory maximum of £3,000.
Senior management also participate in performance-related bonus schemes. The amount paid to employees is based on a
percentage of salary and is paid partly in cash and partly in shares. Bonuses are awarded to eligible employees that have completed
arequired service period and depend on the achievement of corporate targets.
The Executive Directors participate in short-term and long-term bonus schemes designed to align their interests with those of
shareholders. Full details of these schemes can be found in the Directors’ Remuneration Report.
The fair value of shares awarded under these schemes is their market value on the date of award. Expected dividends are not
incorporated into the fair value.
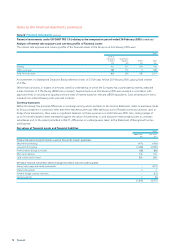
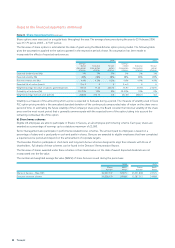
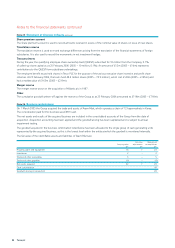
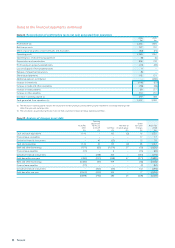
The number and weighted average fair value (WAFV) of share bonuses issued during the period was:
2006 2005
Shares WAFV Shares WAFV
Number Pence Number Pence
Shares in Success – May 2005 22,337,747 309.75 25,331,808 247.25
Executive incentive scheme 16,328,179 309.88 12,287,315 249.88