Tesco 2006 Annual Report Download - page 56
Download and view the complete annual report
Please find page 56 of the 2006 Tesco annual report below. You can navigate through the pages in the report by either clicking on the pages listed below, or by using the keyword search tool below to find specific information within the annual report.-
 1
1 -
2
-
3
-
4
-
5
-
6
-
7
-
8
-
9
-
10
-
11
-
12
-
13
-
14
-
15
-
16
-
17
-
18
-
19
-
20
-
21
-
22
-
23
-
24
-
25
-
26
-
27
-
28
-
29
-
30
-
31
-
32
-
33
-
34
-
35
-
36
-
37
-
38
-
39
-
40
-
41
-
42
-
43
-
44
-
45
-
 46
46 -
 47
47 -
 48
48 -
 49
49 -
 50
50 -
 51
51 -
 52
52 -
 53
53 -
 54
54 -
 55
55 -
 56
56 -
 57
57 -
 58
58 -
 59
59 -
 60
60 -
 61
61 -
 62
62 -
 63
63 -
 64
64 -
 65
65 -
 66
66 -
67
-
68
-
69
-
70
-
71
-
72
-
73
-
74
-
75
-
76
-
77
-
78
-
79
-
80
-
81
-
82
-
83
-
84
-
85
-
86
-
87
-
88
-
89
-
90
-
91
-
92
-
93
-
94
-
95
-
96
-
97
-
98
-
99
-
100
-
101
-
102
-
103
-
104
-
105
-
106
-
107
-
108
-
109
-
110
-
111
-
112
-
113
-
114
-
115
-
116
 |
 |

54 Tesco plc
Notes to the financial statements continued
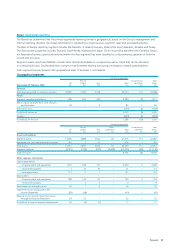
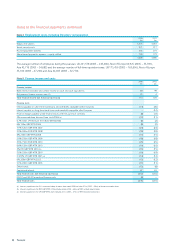
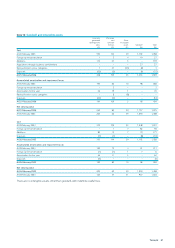
Note 2 Segmental reporting continued
Continuing operations
Rest of Discontinuing Total
UK Europe Asia Total operation Group
Year ended 26 February 2005 £m £m £m £m £m £m
Revenue
Sales to external customers 27,146 3,818 2,902 33,866 108 33,974
Result
Segment operating profit/(loss) 1,556 243 153 1,952 (6) 1,946
Share of post-tax profit from Joint ventures
and Associates 72 1 1 74 1 75
Net finance costs (132) (1) (133)
Profit/(loss) before tax 1,894 (6) 1,888
Taxation (541) – (541)
Profit/(loss) for the year 1,353 (6) 1,347
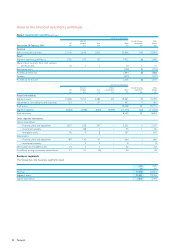
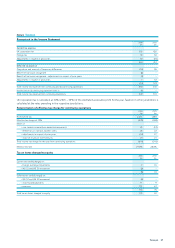
Continuing operations
Rest of Other/ Discontinuing Total
UK Europe Asia unallocated Total operation Group
£m £m £m £m £m £m £m
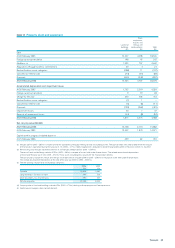
Assets and liabilities
Segment assets 13,206 3,755 2,486 214 19,661 78 19,739
Investment in Joint ventures and Associates 255 1 151 – 407 9 416
Total assets 20,068 87 20,155
Segment liabilities (4,030) (788) (565) (6,092) (11,475) (26) (11,501)
Total net assets 8,593 61 8,654
Other segment information
Capital expenditure:
–Property, plant and equipment 1,637 358 247 – 2,242 5 2,247
–Investment property – 88 7 – 95 1 96
–Intangible assets 90 9 8 – 107 – 107
Depreciation:
– Property, plant and equipment 487 110 67 – 664 2 666
–Investment property – 5 3 – 8 – 8
Amortisation of intangible assets 54 4 4 – 62 – 62
Profit/(loss) arising on property-related items 21 31 (3) – 49 – 49
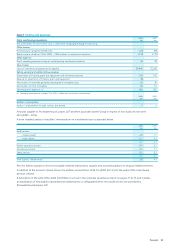
Business segments
The Group has one business segment; retail.
2006 2005
£m £m
Revenue 39,588 33,974
Segment assets 22,087 19,739
Capital expenditure 2,802 2,450