TCF Bank 2014 Annual Report Download - page 76
Download and view the complete annual report
Please find page 76 of the 2014 TCF Bank annual report below. You can navigate through the pages in the report by either clicking on the pages listed below, or by using the keyword search tool below to find specific information within the annual report.-
 1
1 -
2
-
3
-
4
-
5
-
6
-
7
-
8
-
9
-
10
-
11
-
12
-
13
-
14
-
15
-
16
-
17
-
18
-
19
-
20
-
21
-
22
-
23
-
24
-
25
-
26
-
27
-
28
-
29
-
30
-
31
-
32
-
33
-
34
-
35
-
36
-
37
-
38
-
39
-
40
-
41
-
42
-
43
-
44
-
45
-
46
-
47
-
48
-
49
-
50
-
51
-
52
-
53
-
54
-
55
-
56
-
57
-
58
-
59
-
60
-
61
-
62
-
63
-
64
-
65
-
 66
66 -
 67
67 -
 68
68 -
 69
69 -
 70
70 -
 71
71 -
 72
72 -
 73
73 -
 74
74 -
 75
75 -
 76
76 -
 77
77 -
 78
78 -
 79
79 -
 80
80 -
 81
81 -
 82
82 -
 83
83 -
 84
84 -
 85
85 -
 86
86 -
87
-
88
-
89
-
90
-
91
-
92
-
93
-
94
-
95
-
96
-
97
-
98
-
99
-
100
-
101
-
102
-
103
-
104
-
105
-
106
-
107
-
108
-
109
-
110
-
111
-
112
-
113
-
114
-
115
-
116
-
117
-
118
-
119
-
120
-
121
-
122
-
123
-
124
-
125
-
126
-
127
-
128
-
129
-
130
-
131
-
132
-
133
-
134
-
135
 |
 |

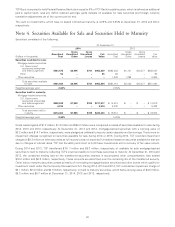
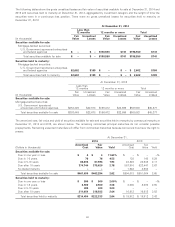
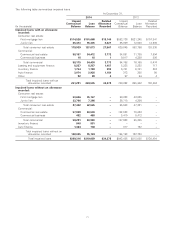
The following tables show the gross unrealized losses and fair value of securities available for sale at December 31, 2014 and
2013 and securities held to maturity at December 31, 2014, aggregated by investment category and the length of time the
securities were in a continuous loss position. There were no gross unrealized losses for securities held to maturity at
December 31, 2013.
At December 31, 2014
Less than
12 months 12 months or more Total
Fair Unrealized Fair Unrealized Fair Unrealized
(In thousands) Value Losses Value Losses Value Losses
Securities available for sale:
Mortgage-backed securities:
U.S. Government sponsored enterprises
and federal agencies $ – $ – $198,550 $741 $198,550 $741
Total securities available for sale $ – $ – $198,550 $741 $198,550 $741
Securities held to maturity:
Mortgage-backed securities:
U.S. Government sponsored enterprises
and federal agencies $2,602 $109 $ – $ – $ 2,602 $109
Total securities held to maturity $2,602 $109 $ – $ – $ 2,602 $109
At December 31, 2013
Less than
12 months 12 months or more Total
Fair Unrealized Fair Unrealized Fair Unrealized
(In thousands) Value Losses Value Losses Value Losses
Securities available for sale:
Mortgage-backed securities:
U.S. Government sponsored
enterprises and federal agencies $353,449 $22,678 $156,472 $22,699 $509,921 $45,377
Total securities available for sale $353,449 $22,678 $156,472 $22,699 $509,921 $45,377
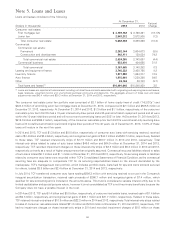
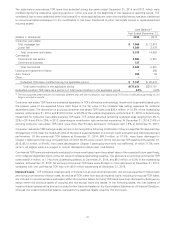
The amortized cost, fair value and yield of securities available for sale and securities held to maturity by contractual maturity at
December 31, 2014 and 2013, are shown below. The remaining contractual principal maturities do not consider possible
prepayments. Remaining expected maturities will differ from contractual maturities because borrowers may have the right to
prepay.
At December 31,
2014 2013
Amortized Fair Amortized Fair
(Dollars in thousands) Cost Value Yield Cost Value Yield
Securities available for sale:
Due in one year or less $ 4 $ 4 11.63% $–$– –%
Due in 1-5 years 76 76 4.53 138 140 5.24
Due in 5-10 years 86,806 87,594 1.93 24,328 24,543 2.17
Due after 10 years 374,744 375,620 2.78 567,910 523,447 2.67
No stated maturity –––1,642 2,934 –
Total securities available for sale $461,630 $463,294 2.62 $594,018 $551,064 2.65
Securities held to maturity:
Due in one year or less $ 500 $ 500 2.00% $–$– –%
Due in 1-5 years 2,500 2,500 3.08 3,000 3,000 2.90
Due in 5-10 years 400 400 3.00 –––
Due after 10 years 211,054 218,933 2.64 16,912 16,912 3.52
Total securities held to maturity $214,454 $222,333 2.64 $ 19,912 $ 19,912 3.43
63