TCF Bank 2014 Annual Report Download - page 33
Download and view the complete annual report
Please find page 33 of the 2014 TCF Bank annual report below. You can navigate through the pages in the report by either clicking on the pages listed below, or by using the keyword search tool below to find specific information within the annual report.-
 1
1 -
2
-
3
-
4
-
5
-
6
-
7
-
8
-
9
-
10
-
11
-
12
-
13
-
14
-
15
-
16
-
17
-
18
-
19
-
20
-
21
-
22
-
 23
23 -
 24
24 -
 25
25 -
 26
26 -
 27
27 -
 28
28 -
 29
29 -
 30
30 -
 31
31 -
 32
32 -
 33
33 -
 34
34 -
 35
35 -
 36
36 -
 37
37 -
 38
38 -
 39
39 -
 40
40 -
 41
41 -
 42
42 -
 43
43 -
44
-
45
-
46
-
47
-
48
-
49
-
50
-
51
-
52
-
53
-
54
-
55
-
56
-
57
-
58
-
59
-
60
-
61
-
62
-
63
-
64
-
65
-
66
-
67
-
68
-
69
-
70
-
71
-
72
-
73
-
74
-
75
-
76
-
77
-
78
-
79
-
80
-
81
-
82
-
83
-
84
-
85
-
86
-
87
-
88
-
89
-
90
-
91
-
92
-
93
-
94
-
95
-
96
-
97
-
98
-
99
-
100
-
101
-
102
-
103
-
104
-
105
-
106
-
107
-
108
-
109
-
110
-
111
-
112
-
113
-
114
-
115
-
116
-
117
-
118
-
119
-
120
-
121
-
122
-
123
-
124
-
125
-
126
-
127
-
128
-
129
-
130
-
131
-
132
-
133
-
134
-
135
 |
 |
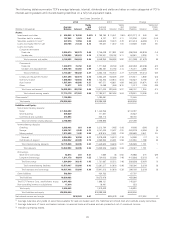
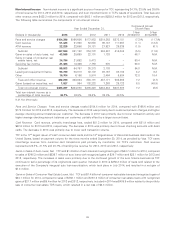
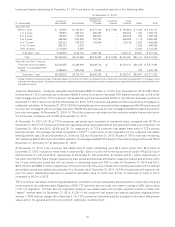
Reportable Segment Results
Lending TCF’s lending strategy is primarily to originate high credit quality secured loans and leases for investment and for sale.
The lending portfolio consists of consumer real estate, commercial real estate and business lending, leasing and equipment
finance, inventory finance and auto finance. Lending’s disciplined portfolio growth generates earning assets and, along with its
fee generating capabilities, produces a significant portion of the Company’s revenue and net income. Lending generated net
income available to common stockholders of $174.7 million for 2014, compared with $136.2 million and $30.9 million for 2013
and 2012, respectively.
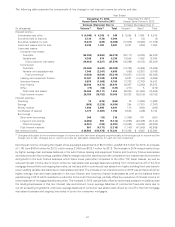
Lending net interest income totaled $592.4 million for 2014, an increase of 4.2% from $568.3 million for 2013, which increased
8.4% from $524.4 million for 2012. The increase in 2014 was primarily driven by higher average loan and lease balances in the
auto finance, leasing and equipment finance and inventory finance businesses. This was partially offset by margin reduction
resulting from the competitive low interest rate environment and reduced interest income due to lower consumer real estate
loan average balances resulting from continued run-off of the first mortgage lien portfolio, as well as a shift in commercial real
estate from higher yielding fixed-rate loans to lower yielding variable rate loans due to marketplace demand.The increase in 2013
was primarily due to higher average balances driven by continued growth in the auto finance and inventory finance businesses,
partially offset by downward pressure on yields across the lending businesses due to the low-interest rate environment.
Lending provision for credit losses totaled $92.8 million for 2014, a decrease of 19.6% from $115.4 million for 2013, which
decreased 53.0% from $245.4 million for 2012. The decrease in provision expense in 2014 was primarily due to decreased net
charge-offs in the consumer real estate and commercial portfolios. This decrease was partially offset by additional provision
expense related to the sale of consumer real estate troubled debt restructuring (‘‘TDR’’) loans and an increase in provision for
credit losses in the auto finance portfolio due to growth coupled with maturation of prior years’ originations. The decrease in net
charge-offs in the consumer real estate portfolio is primarily due to the improving economy, as incidents of default decrease and
home values increase. The decrease in net charge-offs in the commercial portfolio is primarily due to improved credit quality and
continued efforts to actively work out problem loans. The decrease in 2013 was primarily due to a decrease in net charge-offs in
the consumer real estate portfolio resulting from improved home values and a reduction in incidents of default, decreased net
charge-offs in the commercial portfolio due to improved credit quality and continued efforts to actively work out problem loans
and the impact of clarifying bankruptcy-related regulatory guidance related to consumer loans adopted in 2012. See
‘‘Consolidated Income Statement Analysis – Provision for Credit Losses’’ in this Management’s Discussion and Analysis for
further discussion.
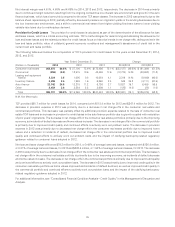
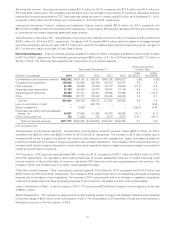
Lending non-interest income totaled $211.2 million for 2014, an increase of 25.4% from $168.4 million for 2013, which increased
21.6% from $138.5 million for 2012. The increases were primarily due to increases in gains on sales of auto loans and consumer
real estate loans, along with increased servicing fee income due to an increase in loans serviced for others. Total loans and leases
serviced for others was $3.4 billion as of December 31, 2014, compared to $2.0 billion and $1.0 billion as of December 31, 2013
and 2012, respectively. See ‘‘Consolidated Income Statement Analysis – Non-Interest Income’’ in this Management’s Discussion
and Analysis for further discussion.
Lending non-interest expense totaled $426.3 million for 2014, an increase of 6.2% from $401.3 million for 2013, which increased
9.3% from $367.2 million for 2012. The increase in 2014 was primarily due to increased staff levels to support the continued
growth of the auto finance business and expenses related to higher commissions and performance incentives based on
production results, partially offset by a decrease in foreclosed real estate and repossessed assets expense, net due to increased
gains on the sales of foreclosed properties and lower write-downs on existing foreclosed properties due to improved property
values. The increase in 2013 was primarily due to increased staff levels to support the growth of the auto finance business and
expenses related to higher commissions based on production results and performance incentives, partially offset by reduced
expenses related to fewer foreclosed consumer properties and a reduction in write-downs in balances of existing foreclosed real
estate properties as a result of improved real estate values.
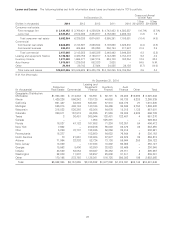
Funding TCF’s funding is primarily derived from branch banking and wholesale borrowings, with a focus on building and
maintaining quality customer relationships. Deposits are generated from consumers and small businesses providing a source of
low cost funds and fee income. Borrowings may be used to offset reductions in deposits or to support lending activities. Funding
reported net income available to common stockholders of $6.1 million for 2014, compared with net income available to common
stockholders of $17.3 million and a net loss available to common stockholders of $239.3 million for 2013 and 2012, respectively.
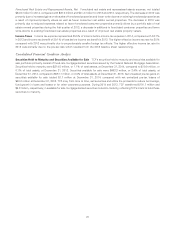
Funding net interest income totaled $226.3 million for 2014, a decrease of 4.6% from $237.3 million for 2013, which decreased
8.1% from $258.3 million for 2012. The decrease in 2014 was primarily due to a reduction in interest income as a result of lower
balances of mortgage-backed securities, partially offset by the reduced cost of borrowings. The decrease in 2013 was primarily
due to a reduction in interest income as a result of lower balances of mortgage-backed securities.
20