TCF Bank 2014 Annual Report Download - page 28
Download and view the complete annual report
Please find page 28 of the 2014 TCF Bank annual report below. You can navigate through the pages in the report by either clicking on the pages listed below, or by using the keyword search tool below to find specific information within the annual report.-
 1
1 -
2
-
3
-
4
-
5
-
6
-
7
-
8
-
9
-
10
-
11
-
12
-
13
-
14
-
15
-
16
-
17
-
 18
18 -
 19
19 -
 20
20 -
 21
21 -
 22
22 -
 23
23 -
 24
24 -
 25
25 -
 26
26 -
 27
27 -
 28
28 -
 29
29 -
 30
30 -
 31
31 -
 32
32 -
 33
33 -
 34
34 -
 35
35 -
 36
36 -
 37
37 -
 38
38 -
39
-
40
-
41
-
42
-
43
-
44
-
45
-
46
-
47
-
48
-
49
-
50
-
51
-
52
-
53
-
54
-
55
-
56
-
57
-
58
-
59
-
60
-
61
-
62
-
63
-
64
-
65
-
66
-
67
-
68
-
69
-
70
-
71
-
72
-
73
-
74
-
75
-
76
-
77
-
78
-
79
-
80
-
81
-
82
-
83
-
84
-
85
-
86
-
87
-
88
-
89
-
90
-
91
-
92
-
93
-
94
-
95
-
96
-
97
-
98
-
99
-
100
-
101
-
102
-
103
-
104
-
105
-
106
-
107
-
108
-
109
-
110
-
111
-
112
-
113
-
114
-
115
-
116
-
117
-
118
-
119
-
120
-
121
-
122
-
123
-
124
-
125
-
126
-
127
-
128
-
129
-
130
-
131
-
132
-
133
-
134
-
135
 |
 |

12FEB201504432999
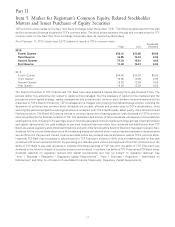
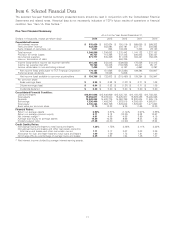
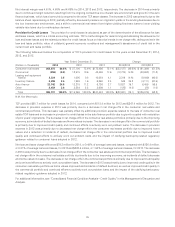
Total Return Performance
The following chart compares the cumulative total stockholder return on TCF common stock over the last five fiscal years with
the cumulative total return of the Standard and Poor’s (‘‘S&P’’) 500 Stock Index, the SNL U.S. Bank and Thrift Index and a
TCF-selected group of peer institutions (assuming the investment of $100 in each index on December 31, 2009 and
reinvestment of all dividends). The TCF Peer Group consists of the publicly-traded banks and thrifts with total assets ranging from
$10 billion to $50 billion as of September 30, 2013.
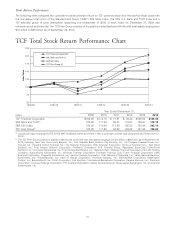
TCF Total Stock Return Performance Chart
50
75
100
125
150
175
200
225
12/31/09 12/31/10 12/31/11 12/31/12 12/31/13 12/31/14
Index Value
TCF Financial Corporation
SNL Bank and Thrift (1)
S&P 500 Index
TCF Peer Group (2)
Year Ended December 31,
Index 2009 2010 2011 2012 2013 2014
TCF Financial Corporation $100.00 $110.16 $ 77.91 $ 93.44 $126.68 $125.46
SNL Bank and Thrift(1) 100.00 111.64 86.81 116.57 159.61 178.18
S&P 500 Index 100.00 115.06 117.49 136.30 180.44 205.14
TCF Peer Group(2) 100.00 111.38 94.98 108.02 151.86 155.65
(1) Includes all major exchange (NYSE, NYSE MKT, NASDAQ) banks and thrifts in SNL’s coverage universe (445 companies as of December 31,
2014).
(2) The TCF Peer Group consists of publicly-traded banks and thrifts with total assets ranging from $10 billion to $50 billion as of September 30,
2013, including: New York Community Bancorp, Inc.; First Republic Bank; Hudson City Bancorp, Inc.; First Niagara Financial Group, Inc.;
Popular, Inc.; People’s United Financial, Inc.; City National Corporation; BOK Financial Corporation; Synovus Financial Corp.; East West
Bancorp, Inc.; First Horizon National Corporation; FirstMerit Corporation; SVB Financial Group; Associated Banc-Corp; Cullen/Frost
Bankers, Inc.; Commerce Bancshares, Inc.; First Citizens BancShares, Inc.; Signature Bank; Webster Financial Corporation; Hancock Holding
Company; Susquehanna Bancshares, Inc.; Wintrust Financial Corporation; EverBank Financial Corp; Fulton Financial Corporation; UMB
Financial Corporation; Prosperity Bancshares, Inc.; Astoria Financial Corporation; First National of Nebraska, Inc.; Valley National Bancorp;
BankUnited, Inc.; PrivateBancorp, Inc.; Bank of Hawaii Corporation; Investors Bancorp, Inc.; IBERIABANK Corporation; Washington
Federal, Inc.; BancorpSouth, Inc.; F.N.B. Corporation; First BanCorp.; International Bancshares Corporation; Flagstar Bancorp, Inc.; Trustmark
Corporation; Umpqua Holdings Corporation; TFS Financial Corporation; Cathay General Bancorp; Texas Capital Bancshares, Inc.; and Central
Bancompany, Inc.
15