TCF Bank 2014 Annual Report Download - page 100
Download and view the complete annual report
Please find page 100 of the 2014 TCF Bank annual report below. You can navigate through the pages in the report by either clicking on the pages listed below, or by using the keyword search tool below to find specific information within the annual report.-
 1
1 -
2
-
3
-
4
-
5
-
6
-
7
-
8
-
9
-
10
-
11
-
12
-
13
-
14
-
15
-
16
-
17
-
18
-
19
-
20
-
21
-
22
-
23
-
24
-
25
-
26
-
27
-
28
-
29
-
30
-
31
-
32
-
33
-
34
-
35
-
36
-
37
-
38
-
39
-
40
-
41
-
42
-
43
-
44
-
45
-
46
-
47
-
48
-
49
-
50
-
51
-
52
-
53
-
54
-
55
-
56
-
57
-
58
-
59
-
60
-
61
-
62
-
63
-
64
-
65
-
66
-
67
-
68
-
69
-
70
-
71
-
72
-
73
-
74
-
75
-
76
-
77
-
78
-
79
-
80
-
81
-
82
-
83
-
84
-
85
-
86
-
87
-
88
-
89
-
 90
90 -
 91
91 -
 92
92 -
 93
93 -
 94
94 -
 95
95 -
 96
96 -
 97
97 -
 98
98 -
 99
99 -
 100
100 -
 101
101 -
 102
102 -
 103
103 -
 104
104 -
 105
105 -
 106
106 -
 107
107 -
 108
108 -
 109
109 -
 110
110 -
111
-
112
-
113
-
114
-
115
-
116
-
117
-
118
-
119
-
120
-
121
-
122
-
123
-
124
-
125
-
126
-
127
-
128
-
129
-
130
-
131
-
132
-
133
-
134
-
135
 |
 |

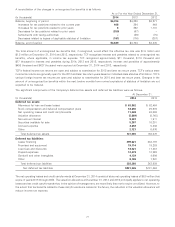
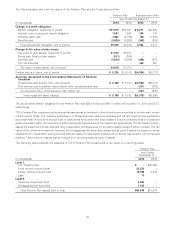
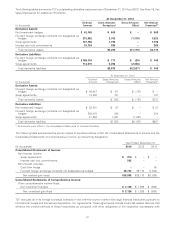
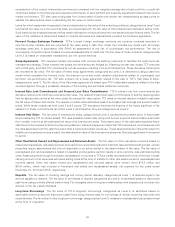
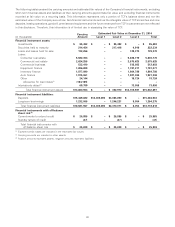
The following tables summarize TCF’s outstanding derivative instruments as of December 31, 2014 and 2013. See Note 19, Fair
Value Disclosures for additional information.
At December 31, 2014
Notional Gross Amounts Gross Amounts Net Amount
(In thousands) Amount Recognized Offset Presented(1)
Derivative Assets:
Net investment hedges $ 42,165 $ 509 $ – $ 509
Forward foreign exchange contracts not designated as
hedges 275,962 2,702 (1,179) 1,523
Swap agreements 101,166 1,798 – 1,798
Interest rate lock commitments 15,124 285 – 285
Total derivative assets $5,294 $(1,179) $4,115
Derivative Liabilities:
Forward foreign exchange contracts not designated as
hedges $ 189,310 $ 177 $ (29) $ 148
Swap agreements 114,970 2,498 (2,498) –
Total derivative liabilities $2,675 $(2,527) $ 148
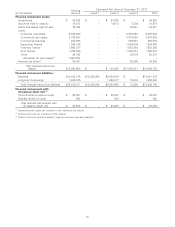
At December 31, 2013
Notional Gross Amounts Gross Amounts Net Amount
(In thousands) Amount Recognized Offset Presented(1)
Derivative Assets:
Forward foreign exchange contracts not designated as
hedges $ 98,847 $ 151 $ (151) $ –
Swap agreements 13,500 131 – 131
Total derivative assets $ 282 $ (151) $131
Derivative Liabilities:
Net investment hedges $ 32,761 $ 87 $ – $ 87
Forward foreign exchange contracts not designated as
hedges 363,475 834 – 834
Swap agreements 41,358 1,031 (1,031) –
Total derivative liabilities $1,952 $(1,031) $921
(1) All amounts were offset in the Consolidated Statements of Financial Condition.
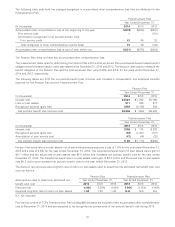
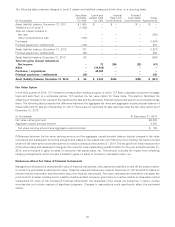
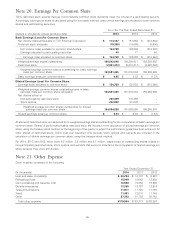
The following table summarizes the pre-tax impact of derivative activity within the Consolidated Statements of Income and the
Consolidated Statements of Comprehensive Income, by accounting designation.
Year Ended December 31,
(In thousands) 2014 2013 2012
Consolidated Statements of Income:
Non-interest income:
Swap agreements $ (79) $–$–
Interest rate lock commitments 285 ––
Non-interest expense:
Cash flow hedge –– (6)
Forward foreign exchange contracts not designated as hedges 38,752 25,170 (7,524)
Net realized gain (loss) $38,958 $25,170 $(7,530)
Consolidated Statements of Comprehensive Income:
Other comprehensive income (loss):
Net investment hedges $ 3,126 $ 1,625 $ (630)
Net unrealized gain (loss) $ 3,126 $ 1,625 $ (630)
TCF executes all of its foreign exchange contracts in the over-the-counter market with large financial institutions pursuant to
International Swaps and Derivatives Association, Inc. agreements. These agreements include credit risk-related features that
enhance the creditworthiness of these instruments as compared with other obligations of the respective counterparty with
87