TCF Bank 2014 Annual Report Download - page 39
Download and view the complete annual report
Please find page 39 of the 2014 TCF Bank annual report below. You can navigate through the pages in the report by either clicking on the pages listed below, or by using the keyword search tool below to find specific information within the annual report.-
 1
1 -
2
-
3
-
4
-
5
-
6
-
7
-
8
-
9
-
10
-
11
-
12
-
13
-
14
-
15
-
16
-
17
-
18
-
19
-
20
-
21
-
22
-
23
-
24
-
25
-
26
-
27
-
28
-
 29
29 -
 30
30 -
 31
31 -
 32
32 -
 33
33 -
 34
34 -
 35
35 -
 36
36 -
 37
37 -
 38
38 -
 39
39 -
 40
40 -
 41
41 -
 42
42 -
 43
43 -
 44
44 -
 45
45 -
 46
46 -
 47
47 -
 48
48 -
 49
49 -
50
-
51
-
52
-
53
-
54
-
55
-
56
-
57
-
58
-
59
-
60
-
61
-
62
-
63
-
64
-
65
-
66
-
67
-
68
-
69
-
70
-
71
-
72
-
73
-
74
-
75
-
76
-
77
-
78
-
79
-
80
-
81
-
82
-
83
-
84
-
85
-
86
-
87
-
88
-
89
-
90
-
91
-
92
-
93
-
94
-
95
-
96
-
97
-
98
-
99
-
100
-
101
-
102
-
103
-
104
-
105
-
106
-
107
-
108
-
109
-
110
-
111
-
112
-
113
-
114
-
115
-
116
-
117
-
118
-
119
-
120
-
121
-
122
-
123
-
124
-
125
-
126
-
127
-
128
-
129
-
130
-
131
-
132
-
133
-
134
-
135
 |
 |

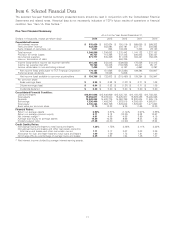
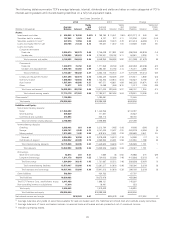
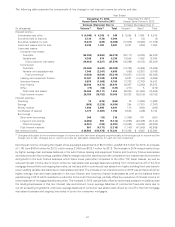
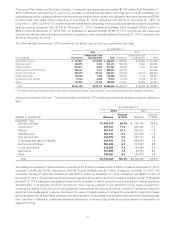
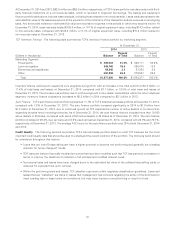
Non-Interest Income Non-interest income is a significant source of revenue for TCF, representing 34.7%, 33.5% and 38.6%
of total revenue for 2014, 2013 and 2012, respectively, and is an important factor in TCF’s results of operations. Total fees and
other revenue were $432.2 million for 2014, compared with $403.1 million and $388.2 million for 2013 and 2012, respectively.
The following table summarizes the components of non-interest income.
Compound Annual
Year Ended December 31, Growth Rate
1-Year 5-Year
(Dollars in thousands) 2014 2013 2012 2011 2010 2014/2013 2014/2009
Fees and service charges $154,386 $166,606 $177,953 $219,363 $273,181 (7.3)% (11.7)%
Card revenue 51,323 51,920 52,638 96,147 111,067 (1.1) (13.3)
ATM revenue 22,225 22,656 24,181 27,927 29,836 (1.9) (6.1)
Subtotal 227,934 241,182 254,772 343,437 414,084 (5.5) (11.6)
Gains on sales of auto loans, net 43,565 29,699 22,101 1,133 – 46.7 N.M.
Gains on sales of consumer real
estate loans, net 34,794 21,692 5,413 – – 60.4 N.M.
Servicing fee income 21,444 13,406 7,759 970 – 60.0 N.M.
Subtotal 99,803 64,797 35,273 2,103 – 54.0 N.M.
Leasing and equipment finance 93,799 90,919 92,172 89,167 89,194 3.2 6.3
Other 10,704 6,196 5,974 2,464 5,584 72.8 15.4
Fees and other revenue 432,240 403,094 388,191 437,171 508,862 7.2 (2.7)
Gains (losses) on securities, net 1,027 964 102,232 7,263 29,123 6.5 (48.9)
Total non-interest income $433,267 $404,058 $490,423 $444,434 $537,985 7.2 (3.8)
Total non-interest income as a
percentage of total revenue 34.7% 33.5% 38.6% 38.8% 43.5%
N.M. Not Meaningful.
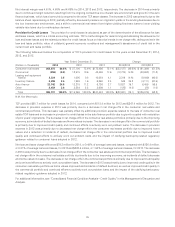
Fees and Service Charges Fees and service charges totaled $154.4 million for 2014, compared with $166.6 million and
$178.0 million for 2013 and 2012, respectively. The decrease in 2014 was primarily due to customer behavior changes and higher
average checking account balances per customer. The decrease in 2013 was primarily due to lower transaction activity and
higher average checking account balances per customer, partially offset by a larger account base.
Card Revenue Card revenue, primarily interchange fees, totaled $51.3 million for 2014, compared with $51.9 million and
$52.6 million for 2013 and 2012, respectively. The decrease in 2014 was primarily due to fewer checking accounts with debit
cards. The decrease in 2013 was primarily due to lower card transaction volume.
TCF is the 17th largest issuer of Visa consumer debit cards and the 13th largest issuer of Visa small business debit cards in the
United States, based on payment volume for the three months ended September 30, 2014, as provided by Visa. TCF earns
interchange revenue from customer card transactions paid primarily by merchants, not TCF’s customers. Card revenue
represented 22.5%, 21.5% and 20.7% of banking fee revenue for 2014, 2013 and 2012, respectively.
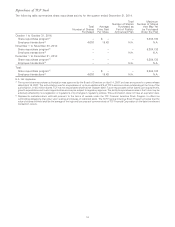
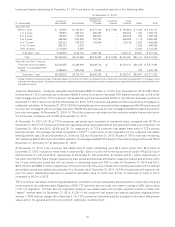
Gains on Sales of Auto Loans, Net TCF sold $1.3 billion of auto loans and recognized a gain of $44.7 million for 2014, compared
to sales of $795.3 million and $536.7 million of auto loans with recognized gains of $29.7 million and $22.1 million for 2013 and
2012, respectively. The increases in sales were primarily due to the continued growth of the auto finance business as TCF
continues to sell a percentage of its originations each quarter. Included in 2014 is $256.3 million of loans sold related to the
execution of the Company’s inaugural auto loan securitization, which took place in July 2014, and resulted in a net gain of
$7.4 million.
Gains on Sales of Consumer Real Estate Loans, Net TCF sold $1.4 billion of consumer real estate loans and recognized a gain of
$34.1 million for 2014, compared to sales of $763.1 million and $161.8 million of consumer real estate loans with recognized
gains of $21.7 million and $5.4 million for 2013 and 2012, respectively. Included in 2014 was $405.9 million related to the portfolio
sale of consumer real estate TDR loans, which resulted in a net loss of $4.8 million.
26