TCF Bank 2014 Annual Report Download - page 69
Download and view the complete annual report
Please find page 69 of the 2014 TCF Bank annual report below. You can navigate through the pages in the report by either clicking on the pages listed below, or by using the keyword search tool below to find specific information within the annual report.-
 1
1 -
2
-
3
-
4
-
5
-
6
-
7
-
8
-
9
-
10
-
11
-
12
-
13
-
14
-
15
-
16
-
17
-
18
-
19
-
20
-
21
-
22
-
23
-
24
-
25
-
26
-
27
-
28
-
29
-
30
-
31
-
32
-
33
-
34
-
35
-
36
-
37
-
38
-
39
-
40
-
41
-
42
-
43
-
44
-
45
-
46
-
47
-
48
-
49
-
50
-
51
-
52
-
53
-
54
-
55
-
56
-
57
-
58
-
 59
59 -
 60
60 -
 61
61 -
 62
62 -
 63
63 -
 64
64 -
 65
65 -
 66
66 -
 67
67 -
 68
68 -
 69
69 -
 70
70 -
 71
71 -
 72
72 -
 73
73 -
 74
74 -
 75
75 -
 76
76 -
 77
77 -
 78
78 -
 79
79 -
80
-
81
-
82
-
83
-
84
-
85
-
86
-
87
-
88
-
89
-
90
-
91
-
92
-
93
-
94
-
95
-
96
-
97
-
98
-
99
-
100
-
101
-
102
-
103
-
104
-
105
-
106
-
107
-
108
-
109
-
110
-
111
-
112
-
113
-
114
-
115
-
116
-
117
-
118
-
119
-
120
-
121
-
122
-
123
-
124
-
125
-
126
-
127
-
128
-
129
-
130
-
131
-
132
-
133
-
134
-
135
 |
 |

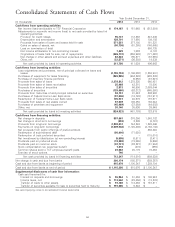
Consolidated Statements of Cash Flows
Year Ended December 31,
(In thousands) 2014 2013 2012
Cash flows from operating activities:
Net income (loss) attributable to TCF Financial Corporation $ 174,187 $ 151,668 $ (212,884)
Adjustments to reconcile net income (loss) to net cash provided by (used in)
operating activities:
Provision for credit losses 95,737 118,368 247,443
Depreciation and amortization 128,701 117,950 109,192
Proceeds from sales of loans and leases held for sale 571,551 277,180 161,221
Gains on sales of assets, net (90,736) (61,265) (140,665)
Loss on termination of debt –– 550,735
Net income attributable to non-controlling interest 7,429 7,032 6,187
Originations of loans held for sale, net of repayments (626,172) (353,982) (171,420)
Net change in other assets and accrued expenses and other liabilities 83,624 190,371 (67,985)
Other, net (32,571) (36,288) 14,839
Net cash provided by (used in) operating activities 311,750 411,034 496,663
Cash flows from investing activities:
Loan originations and purchases, net of principal collected on loans and
leases (2,190,753) (1,196,030) (1,353,981)
Purchases of equipment for lease financing (920,985) (904,383) (938,228)
Purchase of inventory finance portfolios –(9,658) (37,527)
Proceeds from sales of loans 2,278,812 1,378,235 560,421
Proceeds from sales of lease receivables 25,468 43,215 78,805
Proceeds from sales of securities 2,813 46,506 2,089,044
Purchases of securities (139,080) (53,312) (645,880)
Proceeds from maturities of and principal collected on securities 58,151 91,424 202,900
Purchases of Federal Home Loan Bank stock (97,000) (18,789) (157,517)
Redemption of Federal Home Loan Bank stock 105,931 40,976 197,571
Proceeds from sales of real estate owned 67,049 102,250 132,044
Purchases of premises and equipment (45,469) (37,859) (44,082)
Other, net 30,140 35,636 39,949
Net cash provided by (used in) investing activities (824,923) (481,789) 123,519
Cash flows from financing activities:
Net change in deposits 997,661 370,356 1,848,782
Net change in short-term borrowings (493) 2,299 (3,797)
Proceeds from long-term borrowings 2,808,612 744,348 1,283,466
Payments on long-term borrowings (3,009,948) (1,120,402) (4,164,102)
Net proceeds from public offerings of preferred stock –– 263,240
Redemption of subordinated debt (50,000) (71,020) –
Redemption of trust preferred securities –– (115,010)
Net investment by (distribution to) non-controlling interest (5,505) (8,511) (3,411)
Dividends paid on preferred stock (19,388) (19,065) (5,606)
Dividends paid on common stock (32,731) (32,227) (31,904)
Stock compensation tax (expense) benefit 1,316 (473) (659)
Common shares sold to TCF employee benefit plans 23,083 20,179 19,462
Exercise of stock options 740 ––
Net cash provided by (used in) financing activities 713,347 (114,516) (909,539)
Net change in cash and due from banks 200,174 (185,271) (289,357)
Cash and due from banks at beginning of period 915,076 1,100,347 1,389,704
Cash and due from banks at end of period $ 1,115,250 $ 915,076 $ 1,100,347
Supplemental disclosures of cash flow information:
Cash paid (received) for:
Interest on deposits and borrowings $ 55,954 $ 61,453 $ 108,524
Income taxes, net $ 113,562 $ (28,456) $ (13,376)
Transfer of loans to other assets $ 91,180 $ 112,463 $ 137,311
Transfer of securities available for sale to securities held to maturity $ 191,665 $ 9,342 $ –
See accompanying notes to consolidated financial statements
56