TCF Bank 2014 Annual Report Download - page 41
Download and view the complete annual report
Please find page 41 of the 2014 TCF Bank annual report below. You can navigate through the pages in the report by either clicking on the pages listed below, or by using the keyword search tool below to find specific information within the annual report.-
 1
1 -
2
-
3
-
4
-
5
-
6
-
7
-
8
-
9
-
10
-
11
-
12
-
13
-
14
-
15
-
16
-
17
-
18
-
19
-
20
-
21
-
22
-
23
-
24
-
25
-
26
-
27
-
28
-
29
-
30
-
 31
31 -
 32
32 -
 33
33 -
 34
34 -
 35
35 -
 36
36 -
 37
37 -
 38
38 -
 39
39 -
 40
40 -
 41
41 -
 42
42 -
 43
43 -
 44
44 -
 45
45 -
 46
46 -
 47
47 -
 48
48 -
 49
49 -
 50
50 -
 51
51 -
52
-
53
-
54
-
55
-
56
-
57
-
58
-
59
-
60
-
61
-
62
-
63
-
64
-
65
-
66
-
67
-
68
-
69
-
70
-
71
-
72
-
73
-
74
-
75
-
76
-
77
-
78
-
79
-
80
-
81
-
82
-
83
-
84
-
85
-
86
-
87
-
88
-
89
-
90
-
91
-
92
-
93
-
94
-
95
-
96
-
97
-
98
-
99
-
100
-
101
-
102
-
103
-
104
-
105
-
106
-
107
-
108
-
109
-
110
-
111
-
112
-
113
-
114
-
115
-
116
-
117
-
118
-
119
-
120
-
121
-
122
-
123
-
124
-
125
-
126
-
127
-
128
-
129
-
130
-
131
-
132
-
133
-
134
-
135
 |
 |
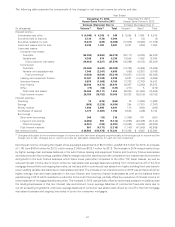
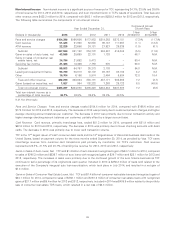
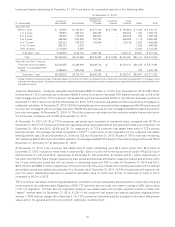
Foreclosed Real Estate and Repossessed Assets, Net Foreclosed real estate and repossessed assets expense, net totaled
$24.6 million for 2014, compared with $28.0 million and $41.4 million for 2013 and 2012, respectively. The decrease in 2014 was
primarily due to increased gains on the sales of foreclosed properties and lower write-downs on existing foreclosed properties as
a result of improved property values as well as fewer consumer real estate owned properties. The decrease in 2013 was
primarily due to reduced expenses related to fewer foreclosed consumer properties primarily driven by a portfolio sale of real
estate owned properties during the first quarter of 2013, a decrease in additions to foreclosed consumer properties and lower
write-downs to existing foreclosed real estate properties as a result of improved real estate property values.
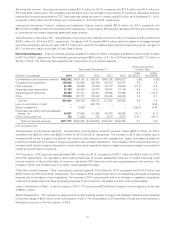
Income Taxes Income tax expense represented 35.5% of income before income tax expense in 2014, compared with 34.7%
in 2013 and income tax benefit of 39.1% of loss before income tax benefit in 2012. The higher effective income tax rate for 2014
compared with 2013 was primarily due to proportionately smaller foreign tax effects. The higher effective income tax rate for
2012 was primarily due to the pre-tax loss which resulted from the 2012 balance sheet repositioning.
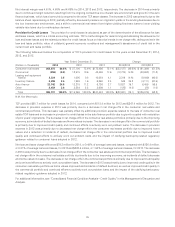
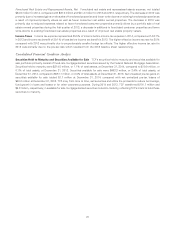
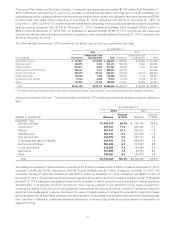
Consolidated Financial Condition Analysis
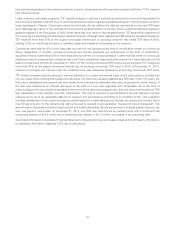
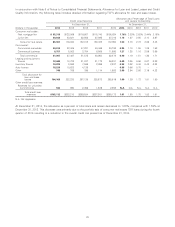
Securities Held to Maturity and Securities Available for Sale TCF’s securities held to maturity and securities available for
sale portfolios primarily consist of fixed-rate mortgage-backed securities issued by the Federal National Mortgage Association.
Securities held to maturity were $214.5 million, or 1.1% of total assets, at December 31, 2014, compared to $19.9 million, or
0.1% of total assets, at December 31, 2013. Securities available for sale were $463.3 million, or 2.4% of total assets, at
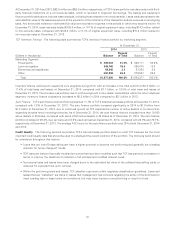
December 31, 2014, compared to $551.1 million, or 3.0% of total assets, at December 31, 2013. Net unrealized pre-tax gains on
securities available for sale totaled $1.7 million at December 31, 2014, compared with net unrealized pre-tax losses of
$43.0 million at December 31, 2013. TCF may, from time to time, sell securities and utilize the proceeds to reduce borrowings,
fund growth in loans and leases or for other corporate purposes. During 2014 and 2013, TCF transferred $191.7 million and
$9.3 million, respectively, in available for sale mortgage-backed securities to held to maturity, reflecting TCF’s intent to hold those
securities to maturity.
28