TCF Bank 2014 Annual Report Download - page 34
Download and view the complete annual report
Please find page 34 of the 2014 TCF Bank annual report below. You can navigate through the pages in the report by either clicking on the pages listed below, or by using the keyword search tool below to find specific information within the annual report.-
 1
1 -
2
-
3
-
4
-
5
-
6
-
7
-
8
-
9
-
10
-
11
-
12
-
13
-
14
-
15
-
16
-
17
-
18
-
19
-
20
-
21
-
22
-
23
-
 24
24 -
 25
25 -
 26
26 -
 27
27 -
 28
28 -
 29
29 -
 30
30 -
 31
31 -
 32
32 -
 33
33 -
 34
34 -
 35
35 -
 36
36 -
 37
37 -
 38
38 -
 39
39 -
 40
40 -
 41
41 -
 42
42 -
 43
43 -
 44
44 -
45
-
46
-
47
-
48
-
49
-
50
-
51
-
52
-
53
-
54
-
55
-
56
-
57
-
58
-
59
-
60
-
61
-
62
-
63
-
64
-
65
-
66
-
67
-
68
-
69
-
70
-
71
-
72
-
73
-
74
-
75
-
76
-
77
-
78
-
79
-
80
-
81
-
82
-
83
-
84
-
85
-
86
-
87
-
88
-
89
-
90
-
91
-
92
-
93
-
94
-
95
-
96
-
97
-
98
-
99
-
100
-
101
-
102
-
103
-
104
-
105
-
106
-
107
-
108
-
109
-
110
-
111
-
112
-
113
-
114
-
115
-
116
-
117
-
118
-
119
-
120
-
121
-
122
-
123
-
124
-
125
-
126
-
127
-
128
-
129
-
130
-
131
-
132
-
133
-
134
-
135
 |
 |
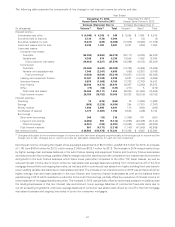
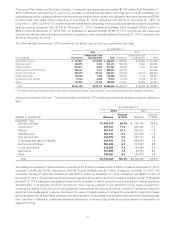
Funding non-interest income totaled $220.6 million for 2014, a decrease of 6.2% from $235.2 million for 2013, which decreased
30.6% from $338.9 million for 2012. The decrease in 2014 was primarily due to a reduction in fees and service charges due to
customer behavior changes and higher average checking account balances per customer. The decrease in 2013 was primarily
due to higher gains on sales of securities during 2012 related to the balance sheet repositioning, lower transaction activity and
higher average checking account balances per customer, partially offset by a larger account base.
Funding non-interest expense totaled $434.1 million for 2014, a decrease of 1.9% from $442.6 million for 2013, which decreased
54.4% from $969.8 million for 2012. The decrease in 2014 was primarily due to the branch realignment which resulted in a
pre-tax charge of $8.9 million in the fourth quarter of 2013. The decrease in 2013 was primarily due to the loss on termination of
debt in connection with the balance sheet repositioning completed in the first quarter of 2012.
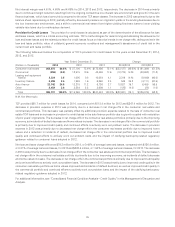
Consolidated Income Statement Analysis
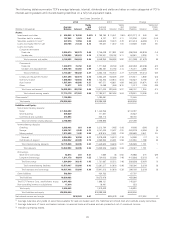
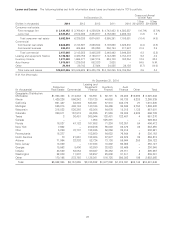
Net Interest Income Net interest income, the difference between interest earned on loans and leases, investments and other
interest-earning assets (interest income) and interest paid on deposits and borrowings (interest expense), represented 65.3% of
TCF’s total revenue for 2014, compared with 66.5% for 2013 and 61.4% for 2012. Net interest income divided by average
interest-earning assets is referred to as the net interest margin, expressed as a percentage. Net interest income and net interest
margin are affected by changes in prevailing short- and long-term interest rates, loan and deposit pricing strategies and
competitive conditions, the volume and the mix of interest-earning assets and both non-interest bearing deposits and
interest-bearing liabilities, the level of non-accrual loans and leases and other real estate owned and the impact of modified loans
and leases.
21