TCF Bank 2014 Annual Report Download - page 57
Download and view the complete annual report
Please find page 57 of the 2014 TCF Bank annual report below. You can navigate through the pages in the report by either clicking on the pages listed below, or by using the keyword search tool below to find specific information within the annual report.-
 1
1 -
2
-
3
-
4
-
5
-
6
-
7
-
8
-
9
-
10
-
11
-
12
-
13
-
14
-
15
-
16
-
17
-
18
-
19
-
20
-
21
-
22
-
23
-
24
-
25
-
26
-
27
-
28
-
29
-
30
-
31
-
32
-
33
-
34
-
35
-
36
-
37
-
38
-
39
-
40
-
41
-
42
-
43
-
44
-
45
-
46
-
 47
47 -
 48
48 -
 49
49 -
 50
50 -
 51
51 -
 52
52 -
 53
53 -
 54
54 -
 55
55 -
 56
56 -
 57
57 -
 58
58 -
 59
59 -
 60
60 -
 61
61 -
 62
62 -
 63
63 -
 64
64 -
 65
65 -
 66
66 -
 67
67 -
68
-
69
-
70
-
71
-
72
-
73
-
74
-
75
-
76
-
77
-
78
-
79
-
80
-
81
-
82
-
83
-
84
-
85
-
86
-
87
-
88
-
89
-
90
-
91
-
92
-
93
-
94
-
95
-
96
-
97
-
98
-
99
-
100
-
101
-
102
-
103
-
104
-
105
-
106
-
107
-
108
-
109
-
110
-
111
-
112
-
113
-
114
-
115
-
116
-
117
-
118
-
119
-
120
-
121
-
122
-
123
-
124
-
125
-
126
-
127
-
128
-
129
-
130
-
131
-
132
-
133
-
134
-
135
 |
 |

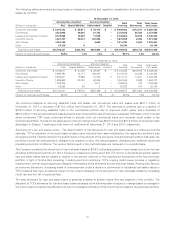
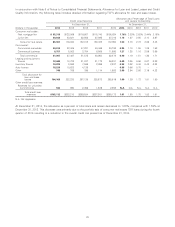
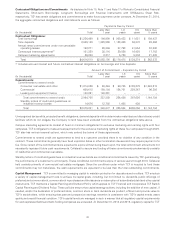
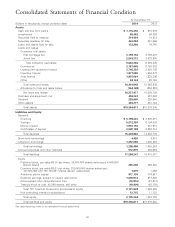
The following table includes reconciliations of the non-GAAP financial measures of tangible common equity, tangible assets and
Tier 1 common capital to the GAAP measures of total equity, total assets and Tier 1 risk-based capital, respectively.
At December 31,
(Dollars in thousands) 2014 2013 2012 2011 2010
Computation of tangible common equity to
tangible assets:
Total equity $ 2,135,364 $ 1,964,759 $ 1,876,643 $ 1,878,627 $ 1,480,163
Less: Non-controlling interest in
subsidiaries 13,715 11,791 13,270 10,494 8,500
Total TCF Financial Corporation
stockholders’ equity 2,121,649 1,952,968 1,863,373 1,868,133 1,471,663
Less:
Preferred stock 263,240 263,240 263,240 – –
Goodwill 225,640 225,640 225,640 225,640 152,599
Other intangibles 4,641 6,326 8,674 7,134 1,232
Tangible common equity $ 1,628,128 $ 1,457,762 $ 1,365,819 $ 1,635,359 $ 1,317,832
Total assets $19,394,611 $18,379,840 $18,225,917 $18,979,388 $18,465,025
Less:
Goodwill 225,640 225,640 225,640 225,640 152,599
Other intangibles 4,641 6,326 8,674 7,134 1,232
Tangible assets $19,164,330 $18,147,874 $17,991,603 $18,746,614 $18,311,194
Tangible common equity to tangible assets 8.50% 8.03% 7.59% 8.72% 7.20%
Computation of Tier 1 risk-based capital ratio:
Total Tier 1 capital $ 1,919,887 $ 1,763,682 $ 1,633,336 $ 1,706,926 $ 1,459,703
Total risk-weighted assets $16,321,425 $15,455,706 $14,733,203 $13,475,330 $13,936,629
Total Tier 1 risk-based capital ratio 11.76% 11.41% 11.09% 12.67% 10.47%
Computation of Tier 1 common capital ratio:
Total Tier 1 capital $ 1,919,887 $ 1,763,682 $ 1,633,336 $ 1,706,926 $ 1,459,703
Less:
Preferred stock 263,240 263,240 263,240 – –
Qualifying non-controlling interest in
subsidiaries 13,715 11,791 13,270 10,494 8,500
Qualifying trust preferred securities –– – 115,000 115,000
Total Tier 1 common capital $ 1,642,932 $ 1,488,651 $ 1,356,826 $ 1,581,432 $ 1,336,203
Total risk-weighted assets $16,321,425 $15,455,706 $14,733,203 $13,475,330 $13,936,629
Total Tier 1 common capital ratio 10.07% 9.63% 9.21% 11.74% 9.59%
Critical Accounting Policies
Critical accounting estimates occur in certain accounting policies and procedures and are particularly susceptible to significant
change. Policies that contain critical accounting estimates include the determination of the allowance for loan and lease losses,
lease financings and income taxes. See Note 1 of Notes to Consolidated Financial Statements, Summary of Significant
Accounting Policies, for further discussion of critical accounting policies.
Recent Accounting Developments
In January 2015, the FASB issued Accounting Standards Update (‘‘ASU’’) No. 2015-01, Simplifying Income Statement
Presentation by Eliminating the Concept of Extraordinary Items, which eliminates from GAAP the concept of an extraordinary
item. As a result, an entity will no longer be required to segregate extraordinary items from the results of ordinary operations, to
separately present an extraordinary item on its income statement, net of tax, after income from continuing operations or to
disclose income taxes and earnings per share data applicable to an extraordinary item. However, presentation and disclosure
guidance for items that are unusual in nature and occur infrequently will be retained. The adoption of this ASU will be required on
a prospective or retrospective basis beginning with TCF’s Quarterly Report on Form 10-Q for the quarter ending March 31, 2016.
The adoption of this ASU is not expected to have a material impact on our consolidated financial statements.
In November 2014, the FASB issued ASU No. 2014-17, Business Combinations: Pushdown Accounting, which provides an
acquired entity with an option to apply pushdown accounting in its separate financial statements upon occurrence of an event in
44