TCF Bank 2014 Annual Report Download - page 51
Download and view the complete annual report
Please find page 51 of the 2014 TCF Bank annual report below. You can navigate through the pages in the report by either clicking on the pages listed below, or by using the keyword search tool below to find specific information within the annual report.-
 1
1 -
2
-
3
-
4
-
5
-
6
-
7
-
8
-
9
-
10
-
11
-
12
-
13
-
14
-
15
-
16
-
17
-
18
-
19
-
20
-
21
-
22
-
23
-
24
-
25
-
26
-
27
-
28
-
29
-
30
-
31
-
32
-
33
-
34
-
35
-
36
-
37
-
38
-
39
-
40
-
 41
41 -
 42
42 -
 43
43 -
 44
44 -
 45
45 -
 46
46 -
 47
47 -
 48
48 -
 49
49 -
 50
50 -
 51
51 -
 52
52 -
 53
53 -
 54
54 -
 55
55 -
 56
56 -
 57
57 -
 58
58 -
 59
59 -
 60
60 -
 61
61 -
62
-
63
-
64
-
65
-
66
-
67
-
68
-
69
-
70
-
71
-
72
-
73
-
74
-
75
-
76
-
77
-
78
-
79
-
80
-
81
-
82
-
83
-
84
-
85
-
86
-
87
-
88
-
89
-
90
-
91
-
92
-
93
-
94
-
95
-
96
-
97
-
98
-
99
-
100
-
101
-
102
-
103
-
104
-
105
-
106
-
107
-
108
-
109
-
110
-
111
-
112
-
113
-
114
-
115
-
116
-
117
-
118
-
119
-
120
-
121
-
122
-
123
-
124
-
125
-
126
-
127
-
128
-
129
-
130
-
131
-
132
-
133
-
134
-
135
 |
 |

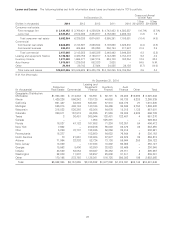
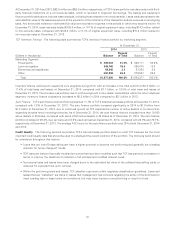
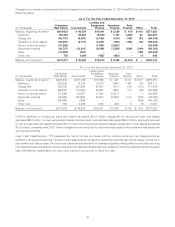
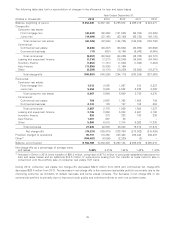
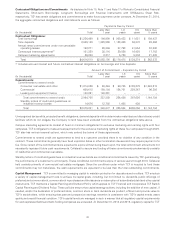
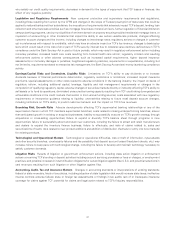
In conjunction with Note 6 of Notes to Consolidated Financial Statements, Allowance for Loan and Lease Losses and Credit
Quality Information, the following table includes detailed information regarding TCF’s allowance for loan and lease losses.
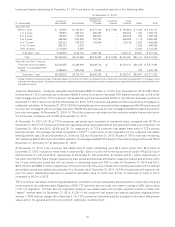
Allowance as a Percentage of Total Loans
Credit Loss Reserves and Leases Outstanding
At December 31, At December 31,
(Dollars in thousands) 2014 2013 2012 2011 2010 2014 2013 2012 2011 2010
Consumer real estate:
First mortgage lien $ 55,319 $133,009 $119,957 $115,740 $105,634 1.76% 3.53% 2.83% 2.44% 2.16%
Junior lien 30,042 43,021 62,056 67,695 67,216 1.18 1.67 2.55 3.14 2.97
Consumer real estate 85,361 176,030 182,013 183,435 172,850 1.50 2.78 2.73 2.66 2.42
Commercial:
Commercial real estate 24,616 32,405 47,821 40,446 50,788 0.94 1.18 1.55 1.26 1.53
Commercial business 6,751 5,062 3,754 6,508 11,690 1.27 1.25 1.16 2.59 3.68
Total commercial 31,367 37,467 51,575 46,954 62,478 0.99 1.19 1.51 1.36 1.71
Leasing and equipment
finance 18,446 18,733 21,037 21,173 26,301 0.49 0.55 0.66 0.67 0.83
Inventory finance 10,020 8,592 7,569 2,996 2,537 0.53 0.52 0.48 0.48 0.32
Auto finance 18,230 10,623 4,136 – – 0.95 0.86 0.75 – –
Other 745 785 798 1,114 1,653 3.09 2.94 2.86 3.19 4.22
Total allowance for
loan and lease
losses 164,169 252,230 267,128 255,672 265,819 1.00 1.59 1.73 1.81 1.80
Other credit loss reserves:
Reserves for unfunded
commitments 943 980 2,456 1,829 2,353 N.A. N.A. N.A. N.A. N.A
Total credit loss
reserves $165,112 $253,210 $269,584 $257,501 $268,172 1.01 1.60 1.75 1.82 1.81
N.A. Not Applicable.
At December 31, 2014, the allowance as a percent of total loans and leases decreased to 1.00%, compared with 1.59% at
December 31, 2013. This decrease was primarily due to the portfolio sale of consumer real estate TDR loans during the fourth
quarter of 2014 resulting in a reduction in the overall credit risk present as of December 31, 2014.
38