TCF Bank 2014 Annual Report Download - page 38
Download and view the complete annual report
Please find page 38 of the 2014 TCF Bank annual report below. You can navigate through the pages in the report by either clicking on the pages listed below, or by using the keyword search tool below to find specific information within the annual report.-
 1
1 -
2
-
3
-
4
-
5
-
6
-
7
-
8
-
9
-
10
-
11
-
12
-
13
-
14
-
15
-
16
-
17
-
18
-
19
-
20
-
21
-
22
-
23
-
24
-
25
-
26
-
27
-
 28
28 -
 29
29 -
 30
30 -
 31
31 -
 32
32 -
 33
33 -
 34
34 -
 35
35 -
 36
36 -
 37
37 -
 38
38 -
 39
39 -
 40
40 -
 41
41 -
 42
42 -
 43
43 -
 44
44 -
 45
45 -
 46
46 -
 47
47 -
 48
48 -
49
-
50
-
51
-
52
-
53
-
54
-
55
-
56
-
57
-
58
-
59
-
60
-
61
-
62
-
63
-
64
-
65
-
66
-
67
-
68
-
69
-
70
-
71
-
72
-
73
-
74
-
75
-
76
-
77
-
78
-
79
-
80
-
81
-
82
-
83
-
84
-
85
-
86
-
87
-
88
-
89
-
90
-
91
-
92
-
93
-
94
-
95
-
96
-
97
-
98
-
99
-
100
-
101
-
102
-
103
-
104
-
105
-
106
-
107
-
108
-
109
-
110
-
111
-
112
-
113
-
114
-
115
-
116
-
117
-
118
-
119
-
120
-
121
-
122
-
123
-
124
-
125
-
126
-
127
-
128
-
129
-
130
-
131
-
132
-
133
-
134
-
135
 |
 |

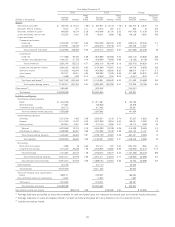
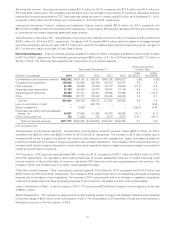
Net interest margin was 4.61%, 4.68% and 4.65% for 2014, 2013 and 2012, respectively. The decrease in 2014 was primarily
due to continued margin reduction resulting from the ongoing competitive low interest rate environment and growth in the auto
finance business, which has a lower yield compared to the other TCF asset classes. The increase in 2013 was primarily due to the
balance sheet repositioning in 2012, partially offset by downward pressure on origination yields in the lending businesses due to
the low interest rate environment, and a shift in commercial real estate from higher yielding fixed-rate loans to lower yielding
variable-rate loans due to marketplace demand.
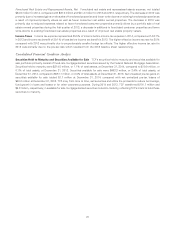
Provision for Credit Losses The provision for credit losses is calculated as part of the determination of the allowance for loan
and lease losses, which is a critical accounting estimate. TCF’s methodologies for determining and allocating the allowance for
loan and lease losses and the related provision for credit losses focus on historical trends in net charge-offs, delinquencies in the
loan and lease portfolio, value of collateral, general economic conditions and management’s assessment of credit risk in the
current loan and lease portfolio.
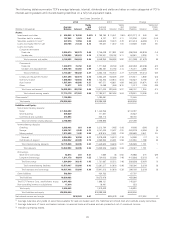
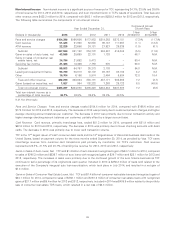
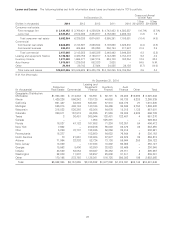
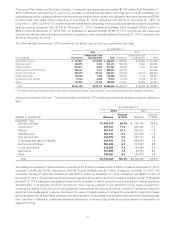
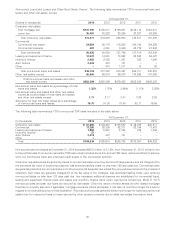
The following table summarizes the composition of TCF’s provision for credit losses for the years ended December 31, 2014,
2013, and 2012.
Year Ended December 31, Change
(Dollars in thousands) 2014 2013 2012 2014/2013 2013/2012
Consumer real estate $63,973 66.8% $ 87,100 73.6% $178,496 72.1% $(23,127) (26.6)% $ (91,396) (51.2)%
Commercial (259) (0.3) 12,515 10.6 43,498 17.6 (12,774) N.M. (30,983) (71.2)
Leasing and equipment
finance 3,324 3.5 1,005 0.8 10,054 4.1 2,319 N.M. (9,049) (90.0)
Inventory finance 2,498 2.6 1,949 1.6 6,060 2.4 549 28.2 (4,111) (67.8)
Auto finance 23,742 24.8 13,215 11.2 6,726 2.7 10,527 79.7 6,489 96.5
Other 2,459 2.6 2,584 2.2 2,609 1.1 (125) (4.8) (25) (1.0)
Total $95,737 100.0% $118,368 100.0% $247,443 100.0% $(22,631) (19.1) $(129,075) (52.2)
N.M. Not Meaningful.
TCF provided $95.7 million for credit losses for 2014, compared with $118.4 million for 2013 and $247.4 million for 2012. The
decrease in provision expense in 2014 was primarily due to a decrease in net charge-offs in the consumer real estate and
commercial portfolios. This decrease was partially offset by additional provision expense related to the sale of consumer real
estate TDR loans and an increase in provision for credit losses in the auto finance portfolio due to growth coupled with maturation
of prior years’ originations. The decrease in net charge-offs in the consumer real estate portfolio is primarily due to the improving
economy, as incidents of default decrease and home values increase. The decrease in net charge-offs in the commercial portfolio
is primarily due to improved credit quality and continued efforts to actively work out problem loans. The decrease in provision
expense in 2013 was primarily due to decreased net charge-offs in the consumer real estate portfolio due to improved home
values and a reduction in incidents of default, decreased net charge-offs in the commercial portfolio due to improved credit
quality and continued efforts to actively work out problem loans and the impact of clarifying bankruptcy-related regulatory
guidance related to consumer loans adopted in 2012.
Net loan and lease charge-offs were $79.3 million for 2014, or 0.49% of average loans and leases, compared with $126.4 million,
or 0.81% of average loans and leases, for 2013 and $233.8 million, or 1.54% of average loans and leases, for 2012. The decrease
in 2014 was primarily due to a decrease in net charge-offs in the consumer real estate and commercial portfolios. The decrease in
net charge-offs in the consumer real estate portfolio is primarily due to the improving economy, as incidents of default decrease
and home values increase. The decrease in net charge-offs in the commercial portfolio is primarily due to improved credit quality
and continued efforts to actively work out problem loans. The decrease in 2013 was primarily due to improved credit quality in the
consumer real estate portfolio as home values improved and incidents of default declined, as well as improved credit quality in
the commercial portfolio and continued efforts to actively work out problem loans, and the impact of the clarifying bankruptcy-
related regulatory guidance adopted in 2012.
For additional information, see ‘‘Consolidated Financial Condition Analysis – Credit Quality’’ in this Management’s Discussion and
Analysis.
25