TCF Bank 2014 Annual Report Download - page 50
Download and view the complete annual report
Please find page 50 of the 2014 TCF Bank annual report below. You can navigate through the pages in the report by either clicking on the pages listed below, or by using the keyword search tool below to find specific information within the annual report.-
 1
1 -
2
-
3
-
4
-
5
-
6
-
7
-
8
-
9
-
10
-
11
-
12
-
13
-
14
-
15
-
16
-
17
-
18
-
19
-
20
-
21
-
22
-
23
-
24
-
25
-
26
-
27
-
28
-
29
-
30
-
31
-
32
-
33
-
34
-
35
-
36
-
37
-
38
-
39
-
 40
40 -
 41
41 -
 42
42 -
 43
43 -
 44
44 -
 45
45 -
 46
46 -
 47
47 -
 48
48 -
 49
49 -
 50
50 -
 51
51 -
 52
52 -
 53
53 -
 54
54 -
 55
55 -
 56
56 -
 57
57 -
 58
58 -
 59
59 -
 60
60 -
61
-
62
-
63
-
64
-
65
-
66
-
67
-
68
-
69
-
70
-
71
-
72
-
73
-
74
-
75
-
76
-
77
-
78
-
79
-
80
-
81
-
82
-
83
-
84
-
85
-
86
-
87
-
88
-
89
-
90
-
91
-
92
-
93
-
94
-
95
-
96
-
97
-
98
-
99
-
100
-
101
-
102
-
103
-
104
-
105
-
106
-
107
-
108
-
109
-
110
-
111
-
112
-
113
-
114
-
115
-
116
-
117
-
118
-
119
-
120
-
121
-
122
-
123
-
124
-
125
-
126
-
127
-
128
-
129
-
130
-
131
-
132
-
133
-
134
-
135
 |
 |

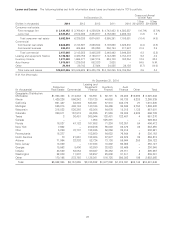
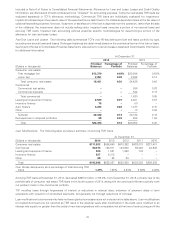
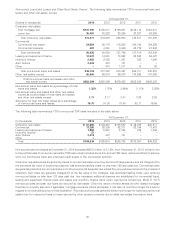
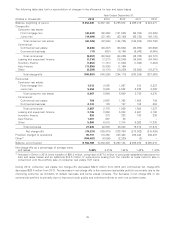
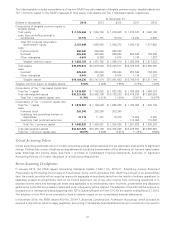
The following tables summarize accruing loans and leases by portfolio and regulatory classification and non-accrual loans and
leases by portfolio.
At December 31, 2014
Accruing Non-classified Accruing Classified Total Total Total Loans
(Dollars in thousands) Pass Special Mention Substandard Doubtful Accruing Non-accrual and Leases
Consumer real estate $ 5,395,103 $ 69,811 $ 44,179 $ – $ 5,509,093 $173,271 $ 5,682,364
Commercial 3,033,992 46,935 51,703 – 3,132,630 25,035 3,157,665
Leasing and equipment finance 3,704,565 16,539 11,548 – 3,732,652 12,670 3,745,322
Inventory finance 1,661,701 90,413 122,894 – 1,875,008 2,082 1,877,090
Auto finance 1,906,740 – 4,645 – 1,911,385 3,676 1,915,061
Other 24,136 8 – – 24,144 – 24,144
Total loans and leases $15,726,237 $223,706 $234,969 $ – $16,184,912 $216,734 $16,401,646
Percent of total loans and leases 95.9% 1.4% 1.4% –% 98.7% 1.3% 100.0%
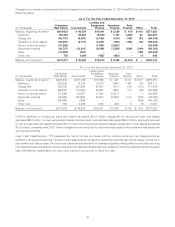
At December 31, 2013
Accruing Non-classified Accruing Classified Total Total Total Loans
(Dollars in thousands) Pass Special Mention Substandard Doubtful Accruing Non-accrual and Leases
Consumer real estate $ 6,049,617 $ 21,309 $ 49,367 $ – $ 6,120,293 $219,033 $ 6,339,326
Commercial 2,896,795 54,711 156,307 – 3,107,813 40,539 3,148,352
Leasing and equipment finance 3,386,301 15,966 12,445 2 3,414,714 14,041 3,428,755
Inventory finance 1,509,960 87,024 64,864 – 1,661,848 2,529 1,664,377
Auto finance 1,236,405 – 2,511 – 1,238,916 470 1,239,386
Other 26,263 68 2 – 26,333 410 26,743
Total loans and leases $15,105,341 $179,078 $285,496 $ 2 $15,569,917 $277,022 $15,846,939
Percent of total loans and leases 95.3% 1.1% 1.8% –% 98.2% 1.8% 100.0%
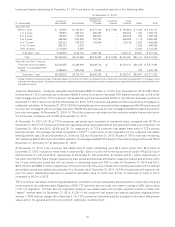
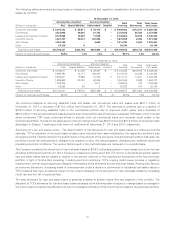
The combined balance of accruing classified loans and leases and non-accrual loans and leases was $451.7 million at
December 31, 2014, a decrease of $110.8 million from December 31, 2013. The decrease is primarily due to a decline of
$104.6 million of accruing classified loans in the commercial portfolio due to improved credit quality and a decrease of
$60.3 million in non-accrual loans and leases primarily due to the portfolio sale of consumer real estate TDR loans, which included
some non-accrual TDR loans, continued efforts to actively work out commercial loans and improved credit quality in the
commercial portfolio. Included in the table above in the non-accrual column are $50.0 million and $81.5 million of consumer loans
discharged in Chapter 7 bankruptcy that were not reaffirmed at December 31, 2014 and 2013, respectively.
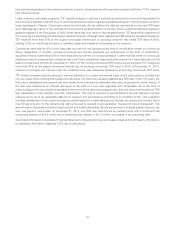
Allowance for Loan and Lease Losses The determination of the allowance for loan and lease losses is a critical accounting
estimate. TCF’s evaluation of incurred losses is based upon historical loss rates multiplied by the respective portfolio’s loss
emergence period. Factors utilized in the determination of the amount of the allowance include historical trends in loss rates, the
portfolios’ overall risk characteristics, changes in its character or size, risk rating migration, delinquencies, collateral values and
prevailing economic conditions. The various factors used in the methodologies are reviewed on a periodic basis.
The Company considers the allowance for loan and lease losses of $164.2 million appropriate to cover losses incurred in the loan
and lease portfolios at December 31, 2014. However, no assurance can be given that TCF will not, in any particular period, sustain
loan and lease losses that are sizable in relation to the amount reserved or that subsequent evaluations of the loan and lease
portfolio, in light of factors then prevailing, including economic conditions, TCF’s ongoing credit review process or regulatory
requirements, will not require significant changes in the balance of the allowance for loan and lease losses. Among other factors,
an economic slowdown, increasing levels of unemployment and/or a decline in commercial or residential real estate values in
TCF’s markets may have an adverse impact on the current adequacy of the allowance for loan and lease losses by increasing
credit risk and the risk of potential loss.
The total allowance for loan and lease losses is generally available to absorb losses from any segment of the portfolio. The
allocation of TCF’s allowance for loan and lease losses disclosed in the following table is subject to change based on changes in
the criteria used to evaluate the allowance and is not necessarily indicative of the trend of future losses in any particular portfolio.
37