Supercuts 2012 Annual Report Download - page 85
Download and view the complete annual report
Please find page 85 of the 2012 Supercuts annual report below. You can navigate through the pages in the report by either clicking on the pages listed below, or by using the keyword search tool below to find specific information within the annual report.-
 1
1 -
2
-
3
-
4
-
5
-
6
-
7
-
8
-
9
-
10
-
11
-
12
-
13
-
14
-
15
-
16
-
17
-
18
-
19
-
20
-
21
-
22
-
23
-
24
-
25
-
26
-
27
-
28
-
29
-
30
-
31
-
32
-
33
-
34
-
35
-
36
-
37
-
38
-
39
-
40
-
41
-
42
-
43
-
44
-
45
-
46
-
47
-
48
-
49
-
50
-
51
-
52
-
53
-
54
-
55
-
56
-
57
-
58
-
59
-
60
-
61
-
62
-
63
-
64
-
65
-
66
-
67
-
68
-
69
-
70
-
71
-
72
-
73
-
74
-
 75
75 -
 76
76 -
 77
77 -
 78
78 -
 79
79 -
 80
80 -
 81
81 -
 82
82 -
 83
83 -
 84
84 -
 85
85 -
 86
86 -
 87
87 -
 88
88 -
 89
89 -
 90
90 -
 91
91 -
 92
92 -
 93
93 -
 94
94 -
 95
95 -
96
-
97
-
98
-
99
-
100
-
101
-
102
-
103
-
104
-
105
-
106
-
107
-
108
-
109
-
110
-
111
-
112
-
113
-
114
-
115
-
116
-
117
-
118
-
119
-
120
-
121
-
122
-
123
-
124
-
125
-
126
-
127
-
128
-
129
-
130
-
131
-
132
-
133
-
134
-
135
-
136
-
137
-
138
-
139
-
140
-
141
-
142
-
143
-
144
-
145
-
146
-
147
-
148
-
149
-
150
-
151
-
152
-
153
-
154
-
155
-
156
-
157
-
158
-
159
-
160
-
161
-
162
-
163
-
164
-
165
-
166
-
167
-
168
-
169
-
170
-
171
-
172
-
173
-
174
-
175
-
176
-
177
-
178
-
179
-
180
-
181
 |
 |

Table of Contents
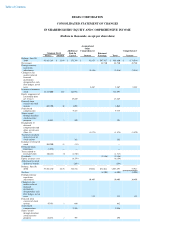
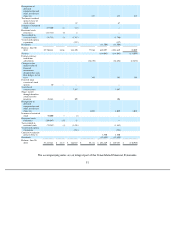
REGIS CORPORATION
CONSOLIDATED STATEMENT OF CASH FLOWS
(Dollars in thousands)
The accompanying notes are an integral part of the Consolidated Financial Statements.
82
Years Ended June 30,
2012 2011 2010
Cash flows from operating activities:
Net (loss) income
$
(114,093
)
$
(8,905
)
$
42,740
Adjustments to reconcile net (loss) income to net cash provided by operating
activities:
Depreciation
101,701
88,602
92,466
Amortization
9,734
9,826
9,870
Equity in loss (income) of affiliated companies
30,043
(7,228
)
(11,942
)
Dividends received from affiliated companies
4,047
10,023
2,404
Deferred income taxes
(14,171
)
(14,711
)
5,115
Impairment on discontinued operations
—
—
(
154
)
Goodwill impairment
146,110
74,100
35,277
Salon asset impairments
6,636
6,681
6,428
Note receivable bad debt (recovery) expense
(805
)
31,227
—
Excess tax benefits from stock
-
based compensation plans
—
(
67
)
(243
)
Stock
-
based compensation
7,597
9,596
9,337
Amortization of debt discount and financing costs
6,696
6,469
6,406
Other noncash items affecting earnings
31
1,578
(3,153
)
Changes in operating assets and liabilities(1):
Receivables
(4,502
)
(2,358
)
1,192
Inventories
2,644
4,629
4,823
Income tax receivable
2,809
23,855
957
Other current assets
(5,272
)
4,725
2,657
Other assets
(841
)
(11,050
)
(14,951
)
Accounts payable
(4,856
)
(2,973
)
(4,966
)
Accrued expenses
(8,657
)
3,341
6,006
Other noncurrent liabilities
(11,151
)
1,818
1,954
Net cash provided by operating activities
153,700
229,178
192,223
Cash flows from investing activities:
Capital expenditures
(85,769
)
(71,469
)
(57,821
)
Proceeds from sale of assets
502
626
70
Asset acquisitions, net of cash acquired and certain obligations assumed
(2,587
)
(17,990
)
(3,664
)
Proceeds from loans and investments
11,995
16,804
16,099
Disbursements for loans and investments
(15,000
)
(72,301
)
—
Freestanding derivative settlement
—
—
736
Net cash used in investing activities
(90,859
)
(144,330
)
(44,580
)
Cash flows from financing activities:
Borrowings on revolving credit facilities
471,500
—
337,000
Payments on revolving credit facilities
(471,500
)
—
(
342,000
)
Proceeds from issuance of long
-
term debt
—
—
167,325
Repayments of long
-
term debt and capital lease obligations
(29,693
)
(137,671
)
(349,175
)
Excess tax benefits from stock
-
based compensation plans
—
67
243
Proceeds from issuance of common stock
—
682
159,498
Dividends paid
(13,855
)
(11,509
)
(9,146
)
Other
—
—
(
2,878
)
Net cash used in financing activities
(43,548
)
(148,431
)
(39,133
)
Effect of exchange rate changes on cash and cash equivalents
(3,613
)
7,975
823
Increase (decrease) in cash and cash equivalents
15,680
(55,608
)
109,333
Cash and cash equivalents:
Beginning of year
96,263
151,871
42,538
End of year
$
111,943
$
96,263
$
151,871
(1)
Changes in operating assets and liabilities exclude assets acquired and liabilities assumed through acquisitions