Supercuts 2012 Annual Report Download - page 140
Download and view the complete annual report
Please find page 140 of the 2012 Supercuts annual report below. You can navigate through the pages in the report by either clicking on the pages listed below, or by using the keyword search tool below to find specific information within the annual report.-
 1
1 -
2
-
3
-
4
-
5
-
6
-
7
-
8
-
9
-
10
-
11
-
12
-
13
-
14
-
15
-
16
-
17
-
18
-
19
-
20
-
21
-
22
-
23
-
24
-
25
-
26
-
27
-
28
-
29
-
30
-
31
-
32
-
33
-
34
-
35
-
36
-
37
-
38
-
39
-
40
-
41
-
42
-
43
-
44
-
45
-
46
-
47
-
48
-
49
-
50
-
51
-
52
-
53
-
54
-
55
-
56
-
57
-
58
-
59
-
60
-
61
-
62
-
63
-
64
-
65
-
66
-
67
-
68
-
69
-
70
-
71
-
72
-
73
-
74
-
75
-
76
-
77
-
78
-
79
-
80
-
81
-
82
-
83
-
84
-
85
-
86
-
87
-
88
-
89
-
90
-
91
-
92
-
93
-
94
-
95
-
96
-
97
-
98
-
99
-
100
-
101
-
102
-
103
-
104
-
105
-
106
-
107
-
108
-
109
-
110
-
111
-
112
-
113
-
114
-
115
-
116
-
117
-
118
-
119
-
120
-
121
-
122
-
123
-
124
-
125
-
126
-
127
-
128
-
129
-
 130
130 -
 131
131 -
 132
132 -
 133
133 -
 134
134 -
 135
135 -
 136
136 -
 137
137 -
 138
138 -
 139
139 -
 140
140 -
 141
141 -
 142
142 -
 143
143 -
 144
144 -
 145
145 -
 146
146 -
 147
147 -
 148
148 -
 149
149 -
 150
150 -
151
-
152
-
153
-
154
-
155
-
156
-
157
-
158
-
159
-
160
-
161
-
162
-
163
-
164
-
165
-
166
-
167
-
168
-
169
-
170
-
171
-
172
-
173
-
174
-
175
-
176
-
177
-
178
-
179
-
180
-
181
 |
 |

Table of Contents
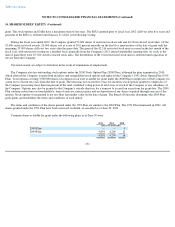
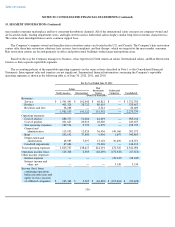
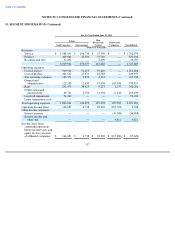
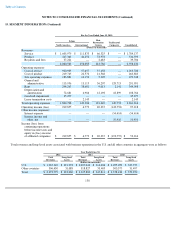
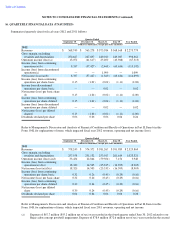
NOTES TO CONSOLIDATED FINANCIAL STATEMENTS (Continued)
15. SEGMENT INFORMATION (Continued)
137
For the Year Ended June 30, 2011
Salons
Hair
Restoration
Centers Unallocated
Corporate
North America International Consolidated
(Dollars in thousands)
Revenues:
Service
$
1,588,690
$
106,734
$
67,550
$
—
$
1,762,974
Product
403,962
43,503
75,729
—
523,194
Royalties and fees
37,292
—
2,409
—
39,701
2,029,944
150,237
145,688
—
2,325,869
Operating expenses:
Cost of service
919,526
54,213
39,129
—
1,012,868
Cost of product
201,560
23,631
24,788
—
249,979
Site operating expenses
183,552
9,852
4,318
—
197,722
General and
administrative
122,281
12,630
37,038
167,908
339,857
Rent
292,479
38,423
9,227
2,157
342,286
Depreciation and
amortization
69,763
4,750
12,958
17,638
105,109
Goodwill impairment
74,100
—
—
—
74,100
Lease termination costs
—
—
—
—
—
Total operating expenses
1,863,261
143,499
127,458
187,703
2,321,921
Operating income (loss)
166,683
6,738
18,230
(187,703
)
3,948
Other income (expense):
Interest expense
—
—
—
(
34,388
)
(34,388
)
Interest income and
other, net
—
—
—
4,811
4,811
Income (loss) from
continuing operations
before income taxes and
equity in (loss) income
of affiliated companies
$
166,683
$
6,738
$
18,230
$
(217,280
)
$
(25,629
)