Supercuts 2012 Annual Report Download - page 68
Download and view the complete annual report
Please find page 68 of the 2012 Supercuts annual report below. You can navigate through the pages in the report by either clicking on the pages listed below, or by using the keyword search tool below to find specific information within the annual report.-
 1
1 -
2
-
3
-
4
-
5
-
6
-
7
-
8
-
9
-
10
-
11
-
12
-
13
-
14
-
15
-
16
-
17
-
18
-
19
-
20
-
21
-
22
-
23
-
24
-
25
-
26
-
27
-
28
-
29
-
30
-
31
-
32
-
33
-
34
-
35
-
36
-
37
-
38
-
39
-
40
-
41
-
42
-
43
-
44
-
45
-
46
-
47
-
48
-
49
-
50
-
51
-
52
-
53
-
54
-
55
-
56
-
57
-
 58
58 -
 59
59 -
 60
60 -
 61
61 -
 62
62 -
 63
63 -
 64
64 -
 65
65 -
 66
66 -
 67
67 -
 68
68 -
 69
69 -
 70
70 -
 71
71 -
 72
72 -
 73
73 -
 74
74 -
 75
75 -
 76
76 -
 77
77 -
 78
78 -
79
-
80
-
81
-
82
-
83
-
84
-
85
-
86
-
87
-
88
-
89
-
90
-
91
-
92
-
93
-
94
-
95
-
96
-
97
-
98
-
99
-
100
-
101
-
102
-
103
-
104
-
105
-
106
-
107
-
108
-
109
-
110
-
111
-
112
-
113
-
114
-
115
-
116
-
117
-
118
-
119
-
120
-
121
-
122
-
123
-
124
-
125
-
126
-
127
-
128
-
129
-
130
-
131
-
132
-
133
-
134
-
135
-
136
-
137
-
138
-
139
-
140
-
141
-
142
-
143
-
144
-
145
-
146
-
147
-
148
-
149
-
150
-
151
-
152
-
153
-
154
-
155
-
156
-
157
-
158
-
159
-
160
-
161
-
162
-
163
-
164
-
165
-
166
-
167
-
168
-
169
-
170
-
171
-
172
-
173
-
174
-
175
-
176
-
177
-
178
-
179
-
180
-
181
 |
 |

Table of Contents
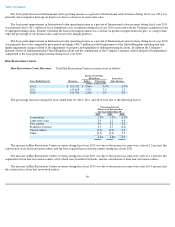
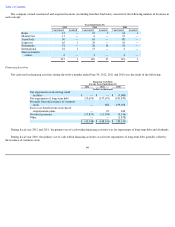
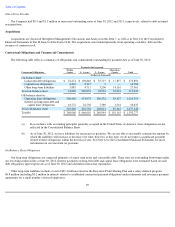
The company-owned constructed and acquired locations (excluding franchise buybacks) consisted of the following number of locations in
each concept:
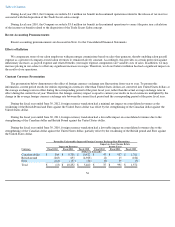
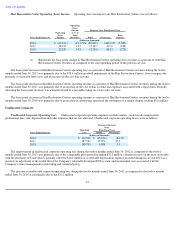
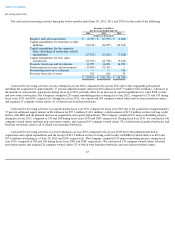
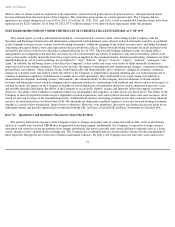
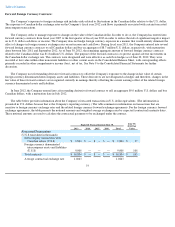
Financing Activities
Net cash used in financing activities during the twelve months ended June 30, 2012, 2011 and 2010 was the result of the following:
During fiscal year 2012 and 2011, the primary use of cash within financing activities was for repayments of long-term debt and dividends.
During fiscal year 2010, the primary use of cash within financing activities was for net repayments of long-term debt, partially offset by
the issuance of common stock.
66
Years Ended June 30,
2012 2011 2010
Constructed Acquired Constructed Acquired Constructed Acquired
Regis
12
—
12
9
14
3
MasterCuts
11
—
6
—
15
—
SmartStyle
50
—
65
—
80
—
Supercuts
65
1
24
—
10
—
Promenade
53
—
26
18
18
—
International
18
1
13
—
2
—
Hair restoration
centers
6
—
3
—
4
—
215
2
149
27
143
3
Financing Cash Flows
For the Years Ended June 30,
2012 2011 2010
(Dollars in thousands)
Net repayments on revolving credit
facilities
$
—
$
—
$
(
5,000
)
Net repayments of long
-
term debt
(29,693
)
(137,671
)
(181,850
)
Proceeds from the issuance of common
stock
—
682
159,498
Excess tax benefit from stock-based
compensation plans
—
67
243
Dividend payments
(13,855
)
(11,509
)
(9,146
)
Other
—
—
(
2,878
)
$
(43,548
)
$
(148,431
)
$
(39,133
)