Supercuts 2012 Annual Report Download - page 47
Download and view the complete annual report
Please find page 47 of the 2012 Supercuts annual report below. You can navigate through the pages in the report by either clicking on the pages listed below, or by using the keyword search tool below to find specific information within the annual report.-
 1
1 -
2
-
3
-
4
-
5
-
6
-
7
-
8
-
9
-
10
-
11
-
12
-
13
-
14
-
15
-
16
-
17
-
18
-
19
-
20
-
21
-
22
-
23
-
24
-
25
-
26
-
27
-
28
-
29
-
30
-
31
-
32
-
33
-
34
-
35
-
36
-
 37
37 -
 38
38 -
 39
39 -
 40
40 -
 41
41 -
 42
42 -
 43
43 -
 44
44 -
 45
45 -
 46
46 -
 47
47 -
 48
48 -
 49
49 -
 50
50 -
 51
51 -
 52
52 -
 53
53 -
 54
54 -
 55
55 -
 56
56 -
 57
57 -
58
-
59
-
60
-
61
-
62
-
63
-
64
-
65
-
66
-
67
-
68
-
69
-
70
-
71
-
72
-
73
-
74
-
75
-
76
-
77
-
78
-
79
-
80
-
81
-
82
-
83
-
84
-
85
-
86
-
87
-
88
-
89
-
90
-
91
-
92
-
93
-
94
-
95
-
96
-
97
-
98
-
99
-
100
-
101
-
102
-
103
-
104
-
105
-
106
-
107
-
108
-
109
-
110
-
111
-
112
-
113
-
114
-
115
-
116
-
117
-
118
-
119
-
120
-
121
-
122
-
123
-
124
-
125
-
126
-
127
-
128
-
129
-
130
-
131
-
132
-
133
-
134
-
135
-
136
-
137
-
138
-
139
-
140
-
141
-
142
-
143
-
144
-
145
-
146
-
147
-
148
-
149
-
150
-
151
-
152
-
153
-
154
-
155
-
156
-
157
-
158
-
159
-
160
-
161
-
162
-
163
-
164
-
165
-
166
-
167
-
168
-
169
-
170
-
171
-
172
-
173
-
174
-
175
-
176
-
177
-
178
-
179
-
180
-
181
 |
 |

Table of Contents
We acquired 13 company-owned salons (including 11 franchise buybacks), and did not acquire or buy back hair restoration centers from
franchisees during fiscal year 2012 compared to 105 company-owned salons (including 78 franchise buybacks), and bought back four hair
restoration centers from franchisees during fiscal year 2011. The same-store sales decrease of 3.1 percent was due to a decrease in same-store
guest visits and marginal declines in average ticket. The Company constructed 209 company-owned salons and six hair restoration centers. We
closed 384 and 305 salons (including 51 and 60 franchise salons) during the twelve months ended June 30, 2012 and 2011, respectively.
We acquired 105 company-owned salons (including 78 franchise buybacks), and bought back four hair restoration centers from
franchisees during fiscal year 2011 compared to 26 company-owned salons (including 23 franchise buybacks), and bought back zero hair
restoration centers from franchisees during fiscal year 2010. The same-store sales decrease of 1.7 percent was due to a decline in same-store
guest visits, partially offset by an increase in average ticket. The Company constructed 146 company-owned salons during the twelve months
ended June 30, 2011. We closed 305 and 269 salons (including 60 and 65 franchise salons) during the twelve months ended June 30, 2011 and
2010, respectively.
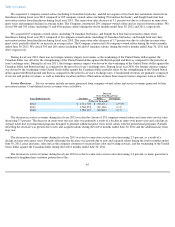
During fiscal year 2012, there was no foreign currency impact on revenues as the weakening of the United States dollar against the
Canadian dollar was offset by the strengthening of the United Stated dollar against the British pound and Euro as compared to the prior fiscal
year's exchange rates. During fiscal year 2011, the foreign currency impact was driven by the weakening of the United States dollar against the
Canadian dollar and British pound, as compared to the prior fiscal year's exchange rates. During fiscal year 2010, the foreign currency impact
was driven by the weakening of the United States dollar against the Canadian dollar, partially offset by the strengthening of the United Stated
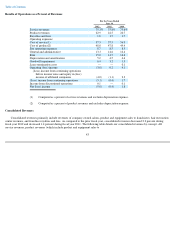
dollar against the British pound and Euro as compared to the prior fiscal year's exchange rates. Consolidated revenues are primarily composed
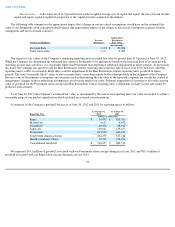
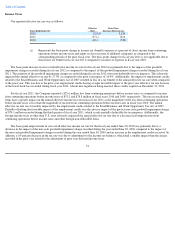
of service and product revenues, as well as franchise royalties and fees. Fluctuations in these three major revenue categories were as follows:
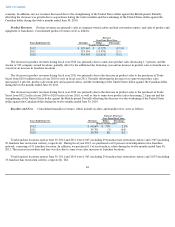
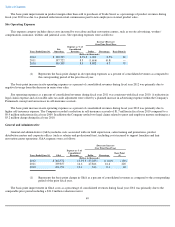
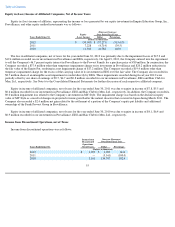
Service Revenues. Service revenues include revenues generated from company-owned salons and service revenues generated by hair
restoration centers. Consolidated service revenues were as follows:
The decrease in service revenues during fiscal year 2012 was due the closure of 333 company-owned salons and same-store service sales
decreasing 3.5 percent. The decrease in same-store services sales was primarily a result of a decline in same-store guest visits and a decline in
average ticket due to promotional programs designed to generate additional guest visits in the salons with the promotional programs. Partially
offsetting the decrease was growth due to new and acquired salons during the twelve months ended June 30, 2012 and the additional day from
leap year.
The decrease in service revenues during fiscal year 2011 was due to same-store service sales decreasing 2.3 percent, as a result of a
decline in same-store guest visits. Partially offsetting the decrease was growth due to new and acquired salons during the twelve months ended
June 30, 2011, price increases, sales mix as the company continues to increase hair color and waxing services, and the weakening of the United
States dollar against the Canadian dollar during the twelve months ended June 30, 2011.
The decrease in service revenues during fiscal year 2010 was due to same-store service sales decreasing 3.4 percent, as many guests have
continued to lengthen their visitation pattern due to the
45
Decrease
Over Prior Fiscal Year
Years Ended June 30, Revenues Dollar Percentage
(Dollars in thousands)
2012
$
1,712,703
$
(50,271
)
(2.9
)%
2011
1,762,974
(21,163
)
(1.2
)
2010
1,784,137
(49,821
)
(2.7
)