Supercuts 2012 Annual Report Download - page 115
Download and view the complete annual report
Please find page 115 of the 2012 Supercuts annual report below. You can navigate through the pages in the report by either clicking on the pages listed below, or by using the keyword search tool below to find specific information within the annual report.-
 1
1 -
2
-
3
-
4
-
5
-
6
-
7
-
8
-
9
-
10
-
11
-
12
-
13
-
14
-
15
-
16
-
17
-
18
-
19
-
20
-
21
-
22
-
23
-
24
-
25
-
26
-
27
-
28
-
29
-
30
-
31
-
32
-
33
-
34
-
35
-
36
-
37
-
38
-
39
-
40
-
41
-
42
-
43
-
44
-
45
-
46
-
47
-
48
-
49
-
50
-
51
-
52
-
53
-
54
-
55
-
56
-
57
-
58
-
59
-
60
-
61
-
62
-
63
-
64
-
65
-
66
-
67
-
68
-
69
-
70
-
71
-
72
-
73
-
74
-
75
-
76
-
77
-
78
-
79
-
80
-
81
-
82
-
83
-
84
-
85
-
86
-
87
-
88
-
89
-
90
-
91
-
92
-
93
-
94
-
95
-
96
-
97
-
98
-
99
-
100
-
101
-
102
-
103
-
104
-
 105
105 -
 106
106 -
 107
107 -
 108
108 -
 109
109 -
 110
110 -
 111
111 -
 112
112 -
 113
113 -
 114
114 -
 115
115 -
 116
116 -
 117
117 -
 118
118 -
 119
119 -
 120
120 -
 121
121 -
 122
122 -
 123
123 -
 124
124 -
 125
125 -
126
-
127
-
128
-
129
-
130
-
131
-
132
-
133
-
134
-
135
-
136
-
137
-
138
-
139
-
140
-
141
-
142
-
143
-
144
-
145
-
146
-
147
-
148
-
149
-
150
-
151
-
152
-
153
-
154
-
155
-
156
-
157
-
158
-
159
-
160
-
161
-
162
-
163
-
164
-
165
-
166
-
167
-
168
-
169
-
170
-
171
-
172
-
173
-
174
-
175
-
176
-
177
-
178
-
179
-
180
-
181
 |
 |

Table of Contents
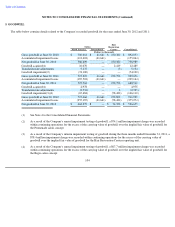
NOTES TO CONSOLIDATED FINANCIAL STATEMENTS (Continued)
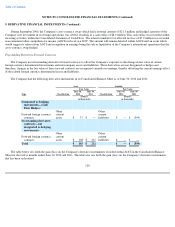
7. FAIR VALUE MEASUREMENTS (Continued)
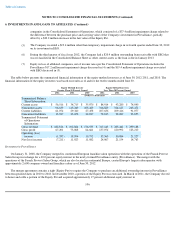
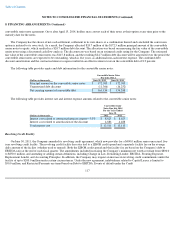
Changes in Financial Instruments Measured at Level 3 Fair Value on a Recurring Basis
The following tables present the changes during the twelve ended June 30, 2012 and 2011 in our Level 3 financial instruments that are
measured at fair value on a recurring basis.
112
Fair Value Measurements
Using Inputs Considered as
Fair Value at
June 30, 2011
Level 1 Level 2 Level 3
(Dollars in thousands)
ASSETS
Current assets
Derivative instruments
$
212
$
—
$
212
$
—
LIABILITIES
Current liabilities
Derivative instruments
$
599
$
—
$
599
$
—
Noncurrent liabilities
Equity put option—
Provalliance
$
22,700
$
—
$
—
$
22,700
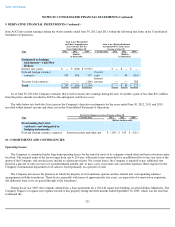
Changes in Financial Instruments
Measured at Level 3 Fair Value Classified as
Roosters
Equity Call Option Roosters
Equity Put Option Provalliance
Equity Put Option
(Dollars in thousands)
Balance at July 1, 2011
$
—
$
—
$
22,700
Total realized and unrealized gains
(losses):
Included in other comprehensive
(loss) income
—
—
(
1,845
)
Issuances
—
161
—
Purchases
117
—
—
Included in equity in (loss) income
of affiliated companies
—
—
(
20,222
)
Balance at June 30, 2012
$
117
$
161
$
633
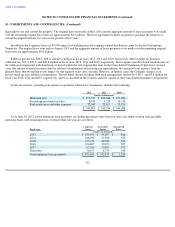
Changes in Financial Instruments
Measured at Level 3 Fair Value
Classified as
Preferred Shares Provalliance
Equity Put Option
(Dollars in thousands)
Balance at July 1, 2010
$
3,502
$
22,009
Total realized and unrealized gains (losses):
Included in other comprehensive income (loss)
433
3,847
Included in equity in (loss) income of affiliated
companies
—
(
2,442
)
Transfer out of Level 3
—
(
714
)
Other than temporary impairment
(3,935
)
—
Balance at June 30, 2011
$
—
$
22,700