Supercuts 2012 Annual Report Download - page 31
Download and view the complete annual report
Please find page 31 of the 2012 Supercuts annual report below. You can navigate through the pages in the report by either clicking on the pages listed below, or by using the keyword search tool below to find specific information within the annual report.-
 1
1 -
2
-
3
-
4
-
5
-
6
-
7
-
8
-
9
-
10
-
11
-
12
-
13
-
14
-
15
-
16
-
17
-
18
-
19
-
20
-
 21
21 -
 22
22 -
 23
23 -
 24
24 -
 25
25 -
 26
26 -
 27
27 -
 28
28 -
 29
29 -
 30
30 -
 31
31 -
 32
32 -
 33
33 -
 34
34 -
 35
35 -
 36
36 -
 37
37 -
 38
38 -
 39
39 -
 40
40 -
 41
41 -
42
-
43
-
44
-
45
-
46
-
47
-
48
-
49
-
50
-
51
-
52
-
53
-
54
-
55
-
56
-
57
-
58
-
59
-
60
-
61
-
62
-
63
-
64
-
65
-
66
-
67
-
68
-
69
-
70
-
71
-
72
-
73
-
74
-
75
-
76
-
77
-
78
-
79
-
80
-
81
-
82
-
83
-
84
-
85
-
86
-
87
-
88
-
89
-
90
-
91
-
92
-
93
-
94
-
95
-
96
-
97
-
98
-
99
-
100
-
101
-
102
-
103
-
104
-
105
-
106
-
107
-
108
-
109
-
110
-
111
-
112
-
113
-
114
-
115
-
116
-
117
-
118
-
119
-
120
-
121
-
122
-
123
-
124
-
125
-
126
-
127
-
128
-
129
-
130
-
131
-
132
-
133
-
134
-
135
-
136
-
137
-
138
-
139
-
140
-
141
-
142
-
143
-
144
-
145
-
146
-
147
-
148
-
149
-
150
-
151
-
152
-
153
-
154
-
155
-
156
-
157
-
158
-
159
-
160
-
161
-
162
-
163
-
164
-
165
-
166
-
167
-
168
-
169
-
170
-
171
-
172
-
173
-
174
-
175
-
176
-
177
-
178
-
179
-
180
-
181
 |
 |

Table of Contents
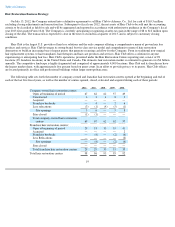
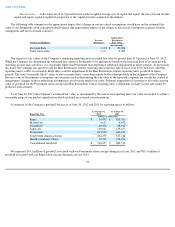
cumulative total return of a peer group index (the Peer Group) constructed by the Company. In addition, the Company has included the
Standard and Poor's 400 Midcap Index and the Dow Jones Consumer Services Index in this analysis because the Company believes these two
indices provide a comparative correlation to the cumulative total return of an investment in shares of Regis Corporation.
The Peer Group consists of the following companies: Advance Auto Parts, Inc., Boyd Gaming Corp., Brinker International, Inc., Coinstar,
Inc., Cracker Barrel Old Country Store, DineEquity, Inc., Fossil, Inc., Fred's, Inc., Green Mountain Coffee Roasters, H&R Block, Inc., Jack in
the Box, Inc., Panera Bread Co., Penn National Gaming, Inc., Revlon, Inc., Sally Beauty Holdings, Inc., Service Corporation International, The
Cheesecake Factory, Inc., and Ulta Salon, Inc. The Peer Group is a self-constructed peer group of companies that have comparable annual
revenues, the guest service element is a critical component to the business, and a target of moderate guests in terms of income and style,
excluding apparel companies.
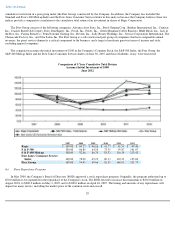
The comparison assumes the initial investment of $100 in the Company's Common Stock, the S&P 500 Index, the Peer Group, the
S&P 400 Midcap Index and the Dow Jones Consumer Services Index on June 30, 2007 and those dividends, if any, were reinvested.
Comparison of 5 Year Cumulative Total Return
Assumes Initial Investment of $100
June 2012
(b) Share Repurchase Program
In May 2000, the Company's Board of Directors (BOD) approved a stock repurchase program. Originally, the program authorized up to
$50.0 million to be expended for the repurchase of the Company's stock. The BOD elected to increase this maximum to $100.0 million in
August 2003, to $200.0 million on May 3, 2005, and to $300.0 million on April 26, 2007. The timing and amounts of any repurchases will
depend on many factors, including the market price of the common stock and overall
29
2007 2008 2009 2010 2011 2012
Regis
$
100.00
$
69.27
$
46.26
$
41.77
$
41.59
$
49.48
S & P 500
100.00
86.88
64.10
73.35
95.87
101.07
S & P 400 Midcap
100.00
92.66
66.70
83.32
116.14
113.42
Dow Jones Consumer Service
Index
100.00
78.98
65.19
80.13
110.33
125.00
Peer Group
100.00
74.45
69.66
81.55
146.95
131.79