Supercuts 2012 Annual Report Download - page 49
Download and view the complete annual report
Please find page 49 of the 2012 Supercuts annual report below. You can navigate through the pages in the report by either clicking on the pages listed below, or by using the keyword search tool below to find specific information within the annual report.-
 1
1 -
2
-
3
-
4
-
5
-
6
-
7
-
8
-
9
-
10
-
11
-
12
-
13
-
14
-
15
-
16
-
17
-
18
-
19
-
20
-
21
-
22
-
23
-
24
-
25
-
26
-
27
-
28
-
29
-
30
-
31
-
32
-
33
-
34
-
35
-
36
-
37
-
38
-
 39
39 -
 40
40 -
 41
41 -
 42
42 -
 43
43 -
 44
44 -
 45
45 -
 46
46 -
 47
47 -
 48
48 -
 49
49 -
 50
50 -
 51
51 -
 52
52 -
 53
53 -
 54
54 -
 55
55 -
 56
56 -
 57
57 -
 58
58 -
 59
59 -
60
-
61
-
62
-
63
-
64
-
65
-
66
-
67
-
68
-
69
-
70
-
71
-
72
-
73
-
74
-
75
-
76
-
77
-
78
-
79
-
80
-
81
-
82
-
83
-
84
-
85
-
86
-
87
-
88
-
89
-
90
-
91
-
92
-
93
-
94
-
95
-
96
-
97
-
98
-
99
-
100
-
101
-
102
-
103
-
104
-
105
-
106
-
107
-
108
-
109
-
110
-
111
-
112
-
113
-
114
-
115
-
116
-
117
-
118
-
119
-
120
-
121
-
122
-
123
-
124
-
125
-
126
-
127
-
128
-
129
-
130
-
131
-
132
-
133
-
134
-
135
-
136
-
137
-
138
-
139
-
140
-
141
-
142
-
143
-
144
-
145
-
146
-
147
-
148
-
149
-
150
-
151
-
152
-
153
-
154
-
155
-
156
-
157
-
158
-
159
-
160
-
161
-
162
-
163
-
164
-
165
-
166
-
167
-
168
-
169
-
170
-
171
-
172
-
173
-
174
-
175
-
176
-
177
-
178
-
179
-
180
-
181
 |
 |

Table of Contents
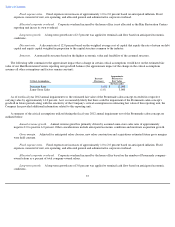
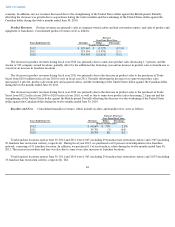
decrease in franchise locations was offset by the impact of the weakening of the United States dollar against the Canadian dollar.
Total franchise locations open at June 30, 2010 and 2009 were 2,053 (including 33 franchise hair restoration centers) and 2,078 (including
33 franchise hair restoration centers), respectively. The increase in consolidated franchise revenues during fiscal year 2010 was primarily due
to the weakening of the United States dollar against the Canadian dollar during the twelve months ended June 30, 2010.
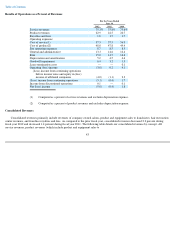
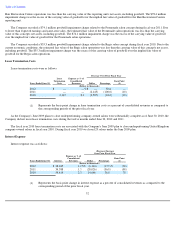
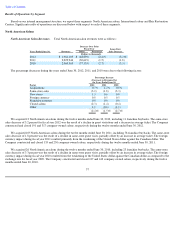
Gross Margin (Excluding Depreciation)
Our cost of revenues primarily includes labor costs related to salon employees and hair restoration center employees, the cost of product
used in providing services and the cost of products sold to guests and franchisees. The resulting gross margin was as follows:
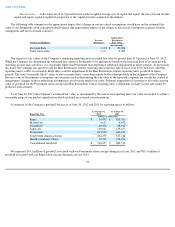
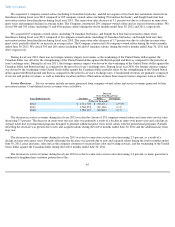
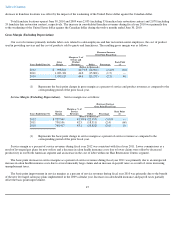
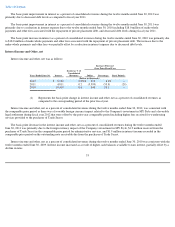
Service Margin (Excluding Depreciation). Service margin was as follows:
Service margin as a percent of service revenues during fiscal year 2012 was consistent with fiscal year 2011. Lower commissions as a
result of leveraged pay plans for new stylists and a decrease in salon health insurance costs due to lower claims were offset by decreased
productivity in our North American segment and an increase in the cost of labor within our Hair Restoration Centers segment.
The basis point decrease in service margins as a percent of service revenues during fiscal year 2011 was primarily due to an unexpected
increase in salon health insurance costs due to several unusually large claims and an increase in payroll taxes as a result of states increasing
unemployment taxes.
The basis point improvement in service margins as a percent of service revenues during fiscal year 2010 was primarily due to the benefit
of the new leveraged salon pay plans implemented in the 2009 calendar year. Increases in salon health insurance and payroll taxes partially
offset the basis point improvement.
47
(Decrease) Increase
Over Prior Fiscal Year
Years Ended June 30, Gross
Margin
Margin as % of
Service and
Product
Revenues Dollar Percentage Basis Point
(1)
(Dollars in thousands)
2012
$
998,361
44.7
%
$
(24,960
)
(2.4
)%
(10
)
2011
1,023,321
44.8
(15,806
)
(1.5
)
—
2010
1,039,127
44.8
(23,279
)
(2.2
)
40
(1) Represents the basis point change in gross margin as a percent of service and product revenues as compared to the
corresponding period of the prior fiscal year.
(Decrease) Increase
Over Prior Fiscal Year
Years Ended June 30, Service
Margin
Margin as % of
Service
Revenues Dollar Percentage Basis Point
(1)
(Dollars in thousands)
2012
$
727,549
42.5
%
$
(22,557
)
(3.0
)%
—
2011
750,106
42.5
(18,311
)
(2.4
)
(60
)
2010
768,417
43.1
(20,822
)
(2.6
)
10
(1) Represents the basis point change in service margin as a percent of service revenues as compared to the
corresponding period of the prior fiscal year.