Starwood 2015 Annual Report Download - page 36
Download and view the complete annual report
Please find page 36 of the 2015 Starwood annual report below. You can navigate through the pages in the report by either clicking on the pages listed below, or by using the keyword search tool below to find specific information within the annual report.-
 1
1 -
2
-
3
-
4
-
5
-
6
-
7
-
8
-
9
-
10
-
11
-
12
-
13
-
14
-
15
-
16
-
17
-
18
-
19
-
20
-
21
-
22
-
23
-
24
-
25
-
 26
26 -
 27
27 -
 28
28 -
 29
29 -
 30
30 -
 31
31 -
 32
32 -
 33
33 -
 34
34 -
 35
35 -
 36
36 -
 37
37 -
 38
38 -
 39
39 -
 40
40 -
 41
41 -
 42
42 -
 43
43 -
 44
44 -
 45
45 -
 46
46 -
47
-
48
-
49
-
50
-
51
-
52
-
53
-
54
-
55
-
56
-
57
-
58
-
59
-
60
-
61
-
62
-
63
-
64
 |
 |

Table of Contents
See the section entitled Potential Payments Upon Termination or Change in Control below in this report for additional information regarding employment
agreements and other arrangements, as applicable, for the named executive officers. See the section entitled 2015 Pay Mix Analysis above in this report for
additional information regarding the amount of salary and bonus in proportion to total compensation for the named executive officers.
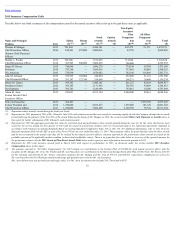
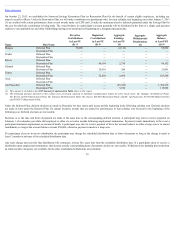
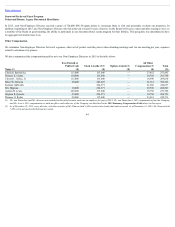
Outstanding Equity Awards at 2015 Fiscal Year-End Table
The following table provides information on the current holdings of stock options and stock awards by the named executive officers as of December 31, 2015. This
table includes unexercised and unvested stock options, unvested restricted stock, unvested restricted stock units and unearned performance shares. Each equity
grant is shown separately for each named executive officer. The market value of the stock awards is based on the closing price of a share on December 31, 2015,
the last business day of the fiscal year, which was $69.28.
Option Awards Stock Awards
Name Grant Date
Number of
Securities
Underlying
Unexercised
Options (#)
Exercisable
(1)
Number of
Securities
Underlying
Unexercised
Options
(#)
Unexercisable
(1)
Option
Exercise
Price
($)
Option
Expiration
Date
Number of
Shares or
Units of
Stock That
Have Not
Vested
(#)
Market
Value of
Shares or
Units of
Stock
That
Have Not
Vested
($)
Equity
Incentive
Plan Awards:
Number of
Unearned
Shares, Units
or
Other Rights
That Have
Not
Vested (#) (2)
Equity
Incentive
Plan Awards:
Market or
Payout Value of
Unearned
Shares, Units or
Other Rights
That Have Not
Vested ($)
Mangas 10/01/2014 — — — — 16,024(3) 1,110,143 — —
2/27/2015 — — — — — — 14,375 995,900
2/27/2015 — — — — 14,375(3) 995,900 — —
Poulter 7/01/2014 — — — — 37,120(4) 2,571,674 — —
2/27/2015 — — — — — — 11,250 779,400
2/27/2015 — — — — 11,250(3) 779,400 — —
Rivera 2/28/2011 3,059 — 61.28 2/28/2019 — — — —
2/28/2012 3,405 3,405 55.06 2/28/2020 — — — —
2/28/2013 — — — — — — 9,985 691,761
2/28/2013 — — — — 4,992(3) 345,846 — —
2/28/2014 — — — — — — 7,327 507,615
2/28/2014 — — — — 7,326(3) 507,545 — —
9/15/2014 — — — — 24,079(4) 1,668,193 — —
2/27/2015 — — — — — — 9,000 623,520
2/27/2015 — — — — 13,500(3) 935,280 — —
Schnaid 2/28/2013 — — — — 5,658(5) 391,986 — —
2/28/2014 — — — — — — 830 57,502
2/28/2014 — — — — 2,214(3) 153,386 — —
2/27/2015 — — — — — — 1,000 69,280
2/27/2015 — — — — 4,000(3) 277,120 — —
Turner 2/28/2012 — 14,189 55.06 2/28/2020 — — — —
2/28/2013 — — — — — — 23,298 1,614,085
2/28/2013 — — — — 7,766(3) 538,028 — —
2/28/2014 — — — — — — 17,096 1,184,411
2/28/2014 — — — — 11,397(3) 789,584 — —
2/27/2015 — — — — — 14,375 995,900
2/27/2015 — — — — 14,375(3) 995,900 — —
Aron 2/28/2011 2,550 — 61.28 2/28/2019 — — — —
2/28/2012 2,838 — 55.06 2/28/2020 — — — —
van
Paaschen 2/28/2013 — — — — — — 39,940 2,767,043
2/28/2014 — — — — — — 18,317 1,269,002
34