Starwood 2015 Annual Report Download - page 17
Download and view the complete annual report
Please find page 17 of the 2015 Starwood annual report below. You can navigate through the pages in the report by either clicking on the pages listed below, or by using the keyword search tool below to find specific information within the annual report.-
 1
1 -
2
-
3
-
4
-
5
-
6
-
 7
7 -
 8
8 -
 9
9 -
 10
10 -
 11
11 -
 12
12 -
 13
13 -
 14
14 -
 15
15 -
 16
16 -
 17
17 -
 18
18 -
 19
19 -
 20
20 -
 21
21 -
 22
22 -
 23
23 -
 24
24 -
 25
25 -
 26
26 -
 27
27 -
28
-
29
-
30
-
31
-
32
-
33
-
34
-
35
-
36
-
37
-
38
-
39
-
40
-
41
-
42
-
43
-
44
-
45
-
46
-
47
-
48
-
49
-
50
-
51
-
52
-
53
-
54
-
55
-
56
-
57
-
58
-
59
-
60
-
61
-
62
-
63
-
64
 |
 |

Table of Contents
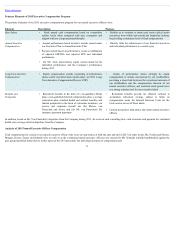
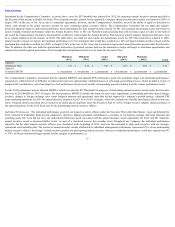
determined by the Compensation Committee. As noted above, since the EP Threshold was achieved for 2015, the maximum annual incentive amount specified in
the Executive Plan became available for award. The maximum incentive payout for the applicable Company financial performance metric was limited to 200% of
target (150% in the case of Mr. Aron, due to contractual agreement), however, and the Compensation Committee reserved the ability to apply its discretion to
reduce such amount to the actual incentive amount for each continuing named executive officer. The Compensation Committee did not apply this negative
discretion approach based on individual performance when determining the final annual incentive payout for Mr. Aron (instead determining to pay him based on
actual Company financial performance under the Annual Incentive Plan) or Mr. van Paasschen (instead paying him cash severance equal in value to one-sixth of
the award the Compensation Committee determined he would have earned under the Annual Incentive Plan based on actual Company financial performance were
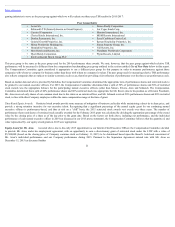
he to remain employed for the entirety of 2015). The table below sets forth for each metric the performance levels for 2015 that would have resulted in 100%
annual incentive payout (or target), the minimum performance level (or minimum) that would have resulted in a 40% (of target) annual incentive payout and the
maximum that would have resulted in a 200% (of target) (150% in the case of Mr. Aron, due to contractual agreement) annual incentive payout under the Executive
Plan. In addition, the table sets forth the approximate mid-points of potential payouts between the minimum to target and target to maximum opportunities and
indicates the related required performance level (straight-line interpolation between levels) under the Executive Plan:
Minimum
(40%)
Mid-point
(70%)
Target
(100%)
Mid-point
(150%)
Maximum
(200%) Actual
Adjusted
earnings per share $ 1.21 $ 2.12 $ 3.03 $ 4.55 $ 6.06 $ 3.10
Adjusted
Company EBITDA $ 484,000,000 $ 847,000,000 $ 1,210,000,000 $ 1,815,000,000 $ 2,420,000,000 $ 1,220,000,000
The Compensation Committee determined that the adjusted EBITDA and adjusted EPS performance goals (for minimum, target and maximum performance)
represented a sufficient level of difficulty of achievement and were appropriately calibrated based on a thorough goal-setting process, which included a review of
budgeted 2015 performance, actual and target levels of performance in prior years and the corresponding payouts resulting from the various performance levels.
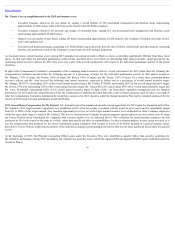
For the 2015 performance period, adjusted EBITDA (which exceeded the EP Threshold) for purposes of determining annual incentive awards under the Executive
Plan was $1,220,000,000 (or 101% of target). For these purposes, EBITDA excludes the impact of asset sales, impairments, restructuring and other special charges
(credits), changes in foreign exchange rates versus budgeted amounts and operational items that did not support the Company’s growth strategy. Adjusted EPS
from continuing operations for 2015 for annual incentive purposes was $3.10 (or 102% of target), which also excludes tax benefits and charges related to non-core
items. Using the metrics described above resulted in an initial payout eligibility under the Executive Plan of 102% of target for the Company financial portion of
the annual incentives for the 2015 fiscal year for the participating named executive officers.
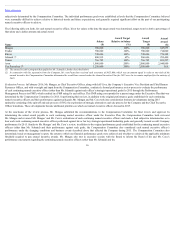
IndividualPerformance. The individual performance goals for our named executive officers under the Executive Plan (other than Messrs. Aron and Schnaid) for
2015 consisted of leadership, financial and competency objectives linking individual contributions to execution of our business strategy and major financial and
operating goals. Mr. Aron did not have any individual performance goals associated with his annual incentive award opportunity for 2015, and Mr. Schnaid’s
annual incentive award is discussed further below. As part of a structured process that cascades down throughout our Company, the individual performance
objectives for the other named executive officers were developed at the beginning of 2015, and were then intended to align each executive with our strategic,
operational and leadership plan. The portion of annual incentive awards attributable to individual management performance represented 25% of our participating
named executive officers’ total target. Actual incentives paid to our participating named executive officers for individual performance could have ranged from 0%
to 175% of the pre-determined target amount for this category of performance, as
15