Starwood 2015 Annual Report Download - page 29
Download and view the complete annual report
Please find page 29 of the 2015 Starwood annual report below. You can navigate through the pages in the report by either clicking on the pages listed below, or by using the keyword search tool below to find specific information within the annual report.-
 1
1 -
2
-
3
-
4
-
5
-
6
-
7
-
8
-
9
-
10
-
11
-
12
-
13
-
14
-
15
-
16
-
17
-
18
-
 19
19 -
 20
20 -
 21
21 -
 22
22 -
 23
23 -
 24
24 -
 25
25 -
 26
26 -
 27
27 -
 28
28 -
 29
29 -
 30
30 -
 31
31 -
 32
32 -
 33
33 -
 34
34 -
 35
35 -
 36
36 -
 37
37 -
 38
38 -
 39
39 -
40
-
41
-
42
-
43
-
44
-
45
-
46
-
47
-
48
-
49
-
50
-
51
-
52
-
53
-
54
-
55
-
56
-
57
-
58
-
59
-
60
-
61
-
62
-
63
-
64
 |
 |

Table of Contents
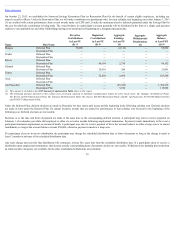
• market capitalization with stronger consideration given to companies within a range of one-third to three times our market capitalization (the median market
capitalization for the peer group as of December 31, 2014 was $22.387 billion, and our market capitalization as of December 31, 2014 was $14.625 billion);
• EBITDA with stronger consideration given to companies within a range of one-third to three times our EBITDA (the median 2014 EBITDA for the peer group
was $1.874 billion, and our 2014 EBITDA was $1.162 billion); and
• international sales as a percentage of total sales (the median 2014 international sales percentage for the peer group was 37%, and our 2014 international sales as
a percentage of total sales was 65%).
We also considered these criteria in light of our business of owning and managing properties, which we believe reflects the scope of responsibilities of our
management team. In particular, given our global scope and unique role in managing property revenues beyond those captured in our financial statements, four
companies that are outside of the revenue or EBITDA criteria outlined above were included in the peer group. The Compensation Committee along with our
management frequently reviews the peer group to ensure it represents a relevant market perspective. A review of the peer group was carried out by Meridian in
2015, and the constituents of the peer group were changed for 2015.
The Compensation Committee used the peer group for a broad set of comparative purposes for 2015, including levels of total compensation for executives and
directors, pay mix, incentive plan design and equity usage and other terms of employment. We believe that by conducting the competitive analysis using a broad
peer group, which includes companies outside the hospitality industry, we are able to attract and retain talented executives from other industries. Our experience
has proven that key executives with diversified experience prove to be major contributors to our continued growth and success.
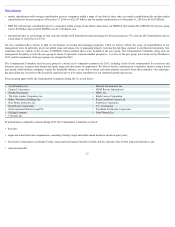
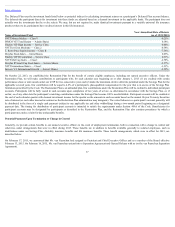
The peer group approved by the Compensation Committee during 2015 is set out below:
• Avon Products, Inc. • Marriott International, Inc.
• Carnival Corporation • MGM Resorts International
• Darden Restaurants • NIKE, Inc.
• The Estée Lauder Companies, Inc. • Ralph Lauren Corporation
• Hilton Worldwide Holdings Inc. • Royal Caribbean Cruises Ltd.
• Host Hotels & Resorts, Inc. • Starbucks Corporation
• Hyatt Hotels Corporation • V.F. Corporation
• InterContinental Hotels Group PLC • Wyndham Worldwide Corporation
• Kellogg Company • Yum! Brands, Inc.
• L Brands, Inc.
In performing its competitive analysis during 2015, the Compensation Committee reviewed:
• base pay;
• target and actual total cash compensation, consisting of salary, target and actual annual incentive awards in prior years;
• direct total compensation consisting of salary, target and actual annual incentive awards, and the expected value of total long-term incentives; and
• retirement benefits.
27