Square Enix 2012 Annual Report Download - page 57
Download and view the complete annual report
Please find page 57 of the 2012 Square Enix annual report below. You can navigate through the pages in the report by either clicking on the pages listed below, or by using the keyword search tool below to find specific information within the annual report.-
 1
1 -
2
-
3
-
4
-
5
-
6
-
7
-
8
-
9
-
10
-
11
-
12
-
13
-
14
-
15
-
16
-
17
-
18
-
19
-
20
-
21
-
22
-
23
-
24
-
25
-
26
-
27
-
28
-
29
-
30
-
31
-
32
-
33
-
34
-
35
-
36
-
37
-
38
-
39
-
40
-
41
-
42
-
43
-
44
-
45
-
46
-
 47
47 -
 48
48 -
 49
49 -
 50
50 -
 51
51 -
 52
52 -
 53
53 -
 54
54 -
 55
55 -
 56
56 -
 57
57 -
 58
58 -
 59
59 -
 60
60 -
 61
61 -
 62
62 -
 63
63 -
 64
64
 |
 |

55
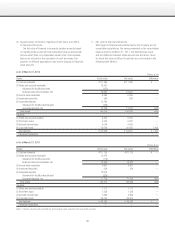
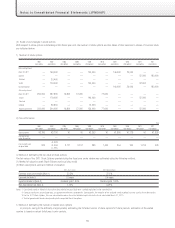
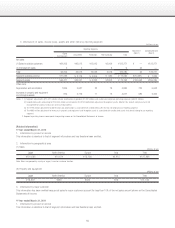
3. Information on sales, income (loss), assets and other items by reporting segment
Millions of yen
Reporting Segments Adjustment
(Note 1)
Consolidated total
(Note 2)
Digital
Entertainment Amusement Publication Merchandising Total
Net sales
(1) Sales to outside customers ¥64,203 ¥45,012 ¥13,045 ¥3,009 ¥125,271 ¥ — ¥125,271
(2) Intersegment sales 0 0 — 8 9 (9) —
Total 64,204 45,012 13,045 3,018 125,280 (9) 125,271
Segment operating income ¥11,283 ¥ 2,178 ¥ 3,204 ¥ 680 ¥ 17,346 ¥ (10,021) ¥ 7,325
Segment assets ¥44,471 ¥23,241 ¥ 5,252 ¥2,803 ¥ 75,768 ¥130,568 ¥206,336
Other items
Depreciation and amortization 1,855 3,987 22 18 5,884 724 6,608
Increases in property and equipment
and intangible assets 874 3,779 11 12 4,677 685 5,363
Notes: 1. (1) Segment adjustments (¥10,021 million) include amortization of goodwill (¥1,492 million) and unallocated corporate operating expenses (¥8,573 million).
(2) Unallocated assets amounting to ¥130,440 million are included in the ¥130,568 million adjustment to segment assets. Most of this amount comprises funds for
management of surplus funds (cash and cash equivalents).
(3) The ¥724 million adjustment to depreciation and amortization is associated with unallocated assets that do not belong to any reporting segment.
(4) The ¥685 million adjustment to increases in property and equipment and intangible assets is associated with unallocated assets that do not belong to any reporting
segment.
2. Segment operating income corresponds to operating income on the Consolidated Statements of Income.
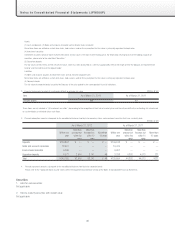
[Related Information]
■ Year ended March 31, 2012
1. Information by product or service
This information is identical to that of segment information and has therefore been omitted.
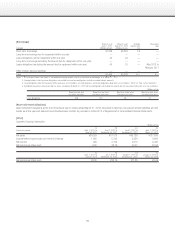
2. Information by geographical area
(1) Sales
Millions of yen
Japan North America Europe Asia Total
¥101,686 ¥10,614 ¥13,180 ¥2,415 ¥127,896
Note: Sales are grouped by country or region, based on customer location.
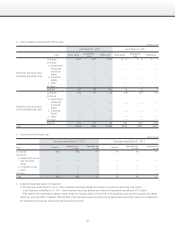
(2) Property and equipment
Millions of yen
Japan North America Europe Asia Total
¥16,297 ¥529 ¥326 ¥29 ¥17,183
3. Information by major customer
This information has been omitted because all sales to major customers account for less than 10% of the net sales amount shown on the Consolidated
Statements of Income.
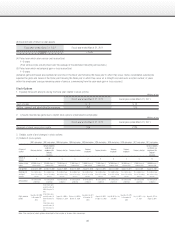
■ Year ended March 31, 2011
1. Information by product or service
This information is identical to that of segment information and has therefore been omitted.