Square Enix 2012 Annual Report Download - page 26
Download and view the complete annual report
Please find page 26 of the 2012 Square Enix annual report below. You can navigate through the pages in the report by either clicking on the pages listed below, or by using the keyword search tool below to find specific information within the annual report.-
 1
1 -
2
-
3
-
4
-
5
-
6
-
7
-
8
-
9
-
10
-
11
-
12
-
13
-
14
-
15
-
 16
16 -
 17
17 -
 18
18 -
 19
19 -
 20
20 -
 21
21 -
 22
22 -
 23
23 -
 24
24 -
 25
25 -
 26
26 -
 27
27 -
 28
28 -
 29
29 -
 30
30 -
 31
31 -
 32
32 -
 33
33 -
 34
34 -
 35
35 -
 36
36 -
37
-
38
-
39
-
40
-
41
-
42
-
43
-
44
-
45
-
46
-
47
-
48
-
49
-
50
-
51
-
52
-
53
-
54
-
55
-
56
-
57
-
58
-
59
-
60
-
61
-
62
-
63
-
64
 |
 |
24
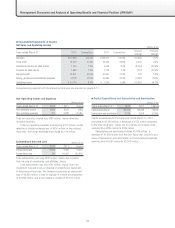
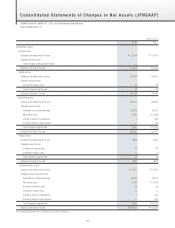
■ Consolidated Statements of Income
Net Sales and Operating Income Millions of yen
Years ended March 31 2012 Composition 2011 Composition Amount
change
Percent
change
Net sales ¥127,896 100.0% ¥125,271 100.0% ¥ 2,625 2.1%
Gross profit 51,627 40.4% 49,424 39.5% 2,202 4.5%
Reversal of provision for sales returns 1,706 1.3% 4,046 3.2% (2,340) (57.8)%
Provision for sales returns 1,502 1.2% 1,779 1.4% (277) (15.6)%
Net gross profit 51,831 40.5% 51,691 41.3% 139 0.3%
Selling, general and administrative expenses 41,118 32.1% 44,365 35.4% (3,247) (7.3)%
Operating income ¥ 10,713 8.4% ¥ 7,325 5.8% ¥ 3,387 46.2%
Comparisons by segment with the preceding fiscal year are provided on pages 8–11.
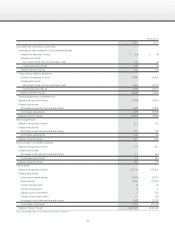
■ Capital Expenditures and Depreciation and Amortization
Millions of yen
Years ended March 31 2012 2011 Change
Capital expenditures ¥5,209 ¥5,363 ¥(153)
Depreciation and amortization
5,039 6,608 (1,569)
Capital expenditures for the fiscal year ended March 31, 2012
amounted to ¥5,209 million, a decrease of ¥153 million compared
to the prior fiscal year, mainly due to a decline in Company-wide
spending from ¥685 million to ¥339 million.
Depreciation and amortization totaled ¥5,039 million, a
decrease of ¥1,569 million from the prior fiscal year, primarily as a
result of depreciation and amortization in the Amusement business
declining from ¥3,987 million to ¥3,363 million.
Non-Operating Income and Expenses
Millions of yen
Years ended March 31 2012 2011 Change
Non-operating income ¥286 ¥347 ¥(60)
Non-operating expenses 701 2,282 (1,580)
Total non-operating income was ¥286 million, mainly reflecting
dividends received.
Total non-operating expenses amounted to ¥701 million, mostly
reflecting a foreign exchange loss of ¥536 million. In the previous
fiscal year, the foreign exchange loss totaled ¥2,149 million.
Extraordinary Gain and Loss Millions of yen
Years ended March 31 2012 2011 Change
Extraordinary gain ¥ 305 ¥ 633 ¥ (327)
Extraordinary loss 741 16,007 (15,265)
Total extraordinary gain was ¥305 million, mainly due to profits
from the sale of subsidiaries’ and affiliates’ stocks.
Total extraordinary loss was ¥741 million, mainly due to an
impairment loss and a loss on disposal of property and equipment.
In the previous fiscal year, the Company recognized an impairment
loss of ¥8,853 million, a loss on disposal of content and equipment
of ¥2,398 million, and a loss related to content of ¥2,074 million.
Management Discussion and Analysis of Operating Results and Financial Position (JPNGAAP)