Square Enix 2012 Annual Report Download - page 52
Download and view the complete annual report
Please find page 52 of the 2012 Square Enix annual report below. You can navigate through the pages in the report by either clicking on the pages listed below, or by using the keyword search tool below to find specific information within the annual report.-
 1
1 -
2
-
3
-
4
-
5
-
6
-
7
-
8
-
9
-
10
-
11
-
12
-
13
-
14
-
15
-
16
-
17
-
18
-
19
-
20
-
21
-
22
-
23
-
24
-
25
-
26
-
27
-
28
-
29
-
30
-
31
-
32
-
33
-
34
-
35
-
36
-
37
-
38
-
39
-
40
-
41
-
 42
42 -
 43
43 -
 44
44 -
 45
45 -
 46
46 -
 47
47 -
 48
48 -
 49
49 -
 50
50 -
 51
51 -
 52
52 -
 53
53 -
 54
54 -
 55
55 -
 56
56 -
 57
57 -
 58
58 -
 59
59 -
 60
60 -
 61
61 -
 62
62 -
63
-
64
 |
 |

50
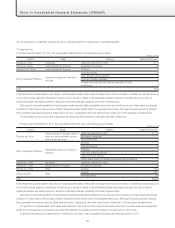
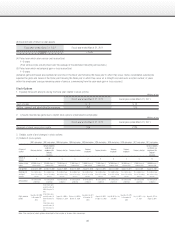
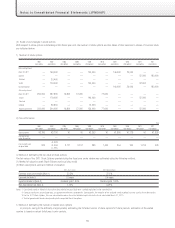
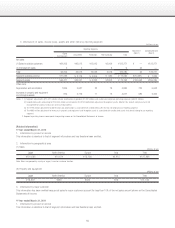
(2) Scale of and changes in stock options
With respect to stock options outstanding at this fiscal year-end, the number of stock options and the status of their exercise to shares of common stock
are indicated below:
1) Number of stock options
2007
stock options
2007
stock options
2008
stock options
2009
stock options
2009
stock options
2010
stock options
2010
stock options
2010
stock options
2011
stock options
2011
stock options
Before vesting (shares)
March 31, 2011
— 199,400 — — 140,000 — 140,000 20,000 — —
Granted
————————87,000 180,000
Forfeited
— 20,400————————
Vested
— 179,000 — — 140,000———87,000 —
Unvested balance
——————140,000 20,000 — 180,000
After vesting (shares)
March 31, 2011
250,000 387,600 19,800 57,000 — 77,000————
Vested
— 179,000 — — 140,000———87,000 —
Exercised
——————————
Forfeited
— 62,600 — — 10,000—————
Balance unexercised
250,000 504,000 19,800 57,000 130,000 77,000 — — 87,000 —
2) Price information
Yen
2007
stock options
2007
stock options
2008
stock options
2009
stock options
2009
stock options
2010
stock options
2010
stock options
2010
stock options
2011
stock options
2011
stock options
Exercise price ¥3,706 ¥3,706 ¥1 ¥1 ¥2,293 ¥1 ¥1,895 ¥1,779 ¥1 ¥1,835
Average share
price at exercise ——————————
Fair market value
on grant date 526
A. 526
B. 594
C. 715
3,171 2,107 385 1,464 364 250 1,312 435
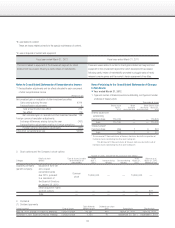
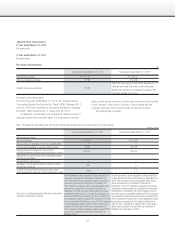
4. Method of estimating the fair value of stock options
The fair value of the 2011 Stock Options granted during the fiscal year under review was estimated using the following method.
(1) Method of valuation used: Black-Scholes option pricing model
(2) Main assumptions used and method of valuation
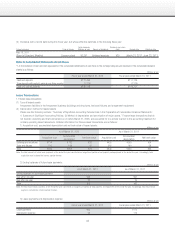
2011 Stock Options 2011 Stock Options
Expected share price volatility (Note 1) 32.3% 37.1%
Expected life (Note 2) 10 years 3.4 years
Expected dividend (Note 3) Dividend yield 1.89% Dividend yield 1.63%
Risk-free interest rate (Note 4) 1.10% 0.21%
Notes: 1. Calculated based on historical share price data prior to the grant date over a period equivalent to the expected life.
2. Owing to insufficient accumulated data, an appropriate estimate is problematic. Consequently, the midpoint of the available exercise period has been used as the estimated life.
3. For the 2011 Stock Options, this was calculated based on the actual dividend applicable to the fiscal year ended March 31, 2011.
4. Yield of government bonds corresponding to the expected life of the options.
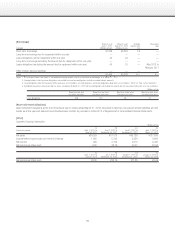
5. Method of estimating the number of vested stock options
In principle, owing to the difficulty of appropriately estimating the forfeited number of stock options for future periods, estimation of the vested
number is based on actual forfeitures in prior periods.
Notes to Consolidated Financial Statements (JPNGAAP)