Square Enix 2012 Annual Report Download - page 25
Download and view the complete annual report
Please find page 25 of the 2012 Square Enix annual report below. You can navigate through the pages in the report by either clicking on the pages listed below, or by using the keyword search tool below to find specific information within the annual report.-
 1
1 -
2
-
3
-
4
-
5
-
6
-
7
-
8
-
9
-
10
-
11
-
12
-
13
-
14
-
 15
15 -
 16
16 -
 17
17 -
 18
18 -
 19
19 -
 20
20 -
 21
21 -
 22
22 -
 23
23 -
 24
24 -
 25
25 -
 26
26 -
 27
27 -
 28
28 -
 29
29 -
 30
30 -
 31
31 -
 32
32 -
 33
33 -
 34
34 -
 35
35 -
36
-
37
-
38
-
39
-
40
-
41
-
42
-
43
-
44
-
45
-
46
-
47
-
48
-
49
-
50
-
51
-
52
-
53
-
54
-
55
-
56
-
57
-
58
-
59
-
60
-
61
-
62
-
63
-
64
 |
 |

23
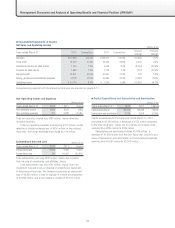
Intangible Assets Millions of yen
March 31 2012 2011 Change
¥10,121 ¥10,324 ¥(202)
Total intangible assets as of March 31, 2012 amounted to ¥10,121
million, a decrease of ¥202 million from the prior fiscal year, mainly
due to software amortization costs.
Investments and Other Assets Millions of yen
March 31 2012 2011 Change
¥14,514 ¥14,382 ¥132
Total investments and other assets increased by ¥132 million, to
¥14,514 million as of March 31, 2012, primarily due to increases in
guarantee deposits.
■ Liabilities Millions of yen
March 31 2012 2011 Change
¥76,684 ¥71,192 ¥5,491
As of March 31, 2012, total liabilities amounted to ¥76,684 million,
an increase of ¥5,491 million compared to the prior fiscal year.
The main factors contributing to the change were as follows:
Current Liabilities Millions of yen
March 31 2012 2011 Change
¥33,778 ¥28,504 ¥5,273
Total current liabilities increased by ¥5,273 million, to ¥33,778
million as of March 31, 2012. This was mainly due to an increase in
notes and accounts payable from ¥7,777 million to ¥9,220 million,
an increase in short-term loans from ¥1,338 million to ¥5,253
million, and an increase in accrued income taxes from ¥2,269
million to ¥4,034 million.
Non-Current Liabilities Millions of yen
March 31 2012 2011 Change
¥42,906 ¥42,687 ¥218
Total non-current liabilities increased by ¥218 million to ¥42,906
million as of March 31, 2012, primarily due to an increase in the
provision for employees’ retirement benefits from ¥3,061 million to
¥3,808 million.
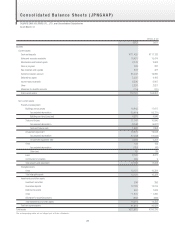
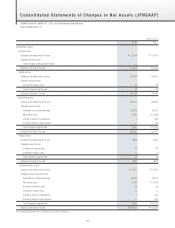
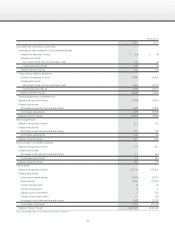
■ Shareholders’ Equity/Net Assets
Millions of yen
March 31 2012 2011 Change
Common stock ¥ 15,204 ¥ 15,204 ¥ —
Capital surplus 44,444 44,444 (0)
Retained earnings 85,320 82,711 2,609
Treasury stock (861) (859) (2)
Total shareholders’ equity 144,108 141,501 2,606
Unrealized gain (loss)
on revaluation of other
investment securities
124 (14) 139
Foreign currency translation
adjustments (8,696) (7,929) (767)
Total accumulated other
comprehensive loss (8,572) (7,943) (628)
Stock acquisition rights 977 814 163
Minority interests in
consolidated subsidiaries 783 771 12
Total net assets ¥137,297 ¥135,143 ¥2,153
As of March 31, 2012, total net assets amounted to ¥137,297
million, up ¥2,153 million compared to the prior fiscal year, reflecting
an increase in retained earnings due to the recording of net income.