Square Enix 2012 Annual Report Download - page 3
Download and view the complete annual report
Please find page 3 of the 2012 Square Enix annual report below. You can navigate through the pages in the report by either clicking on the pages listed below, or by using the keyword search tool below to find specific information within the annual report.-
 1
1 -
 2
2 -
 3
3 -
 4
4 -
 5
5 -
 6
6 -
 7
7 -
 8
8 -
 9
9 -
 10
10 -
 11
11 -
 12
12 -
 13
13 -
 14
14 -
15
-
16
-
17
-
18
-
19
-
20
-
21
-
22
-
23
-
24
-
25
-
26
-
27
-
28
-
29
-
30
-
31
-
32
-
33
-
34
-
35
-
36
-
37
-
38
-
39
-
40
-
41
-
42
-
43
-
44
-
45
-
46
-
47
-
48
-
49
-
50
-
51
-
52
-
53
-
54
-
55
-
56
-
57
-
58
-
59
-
60
-
61
-
62
-
63
-
64
 |
 |
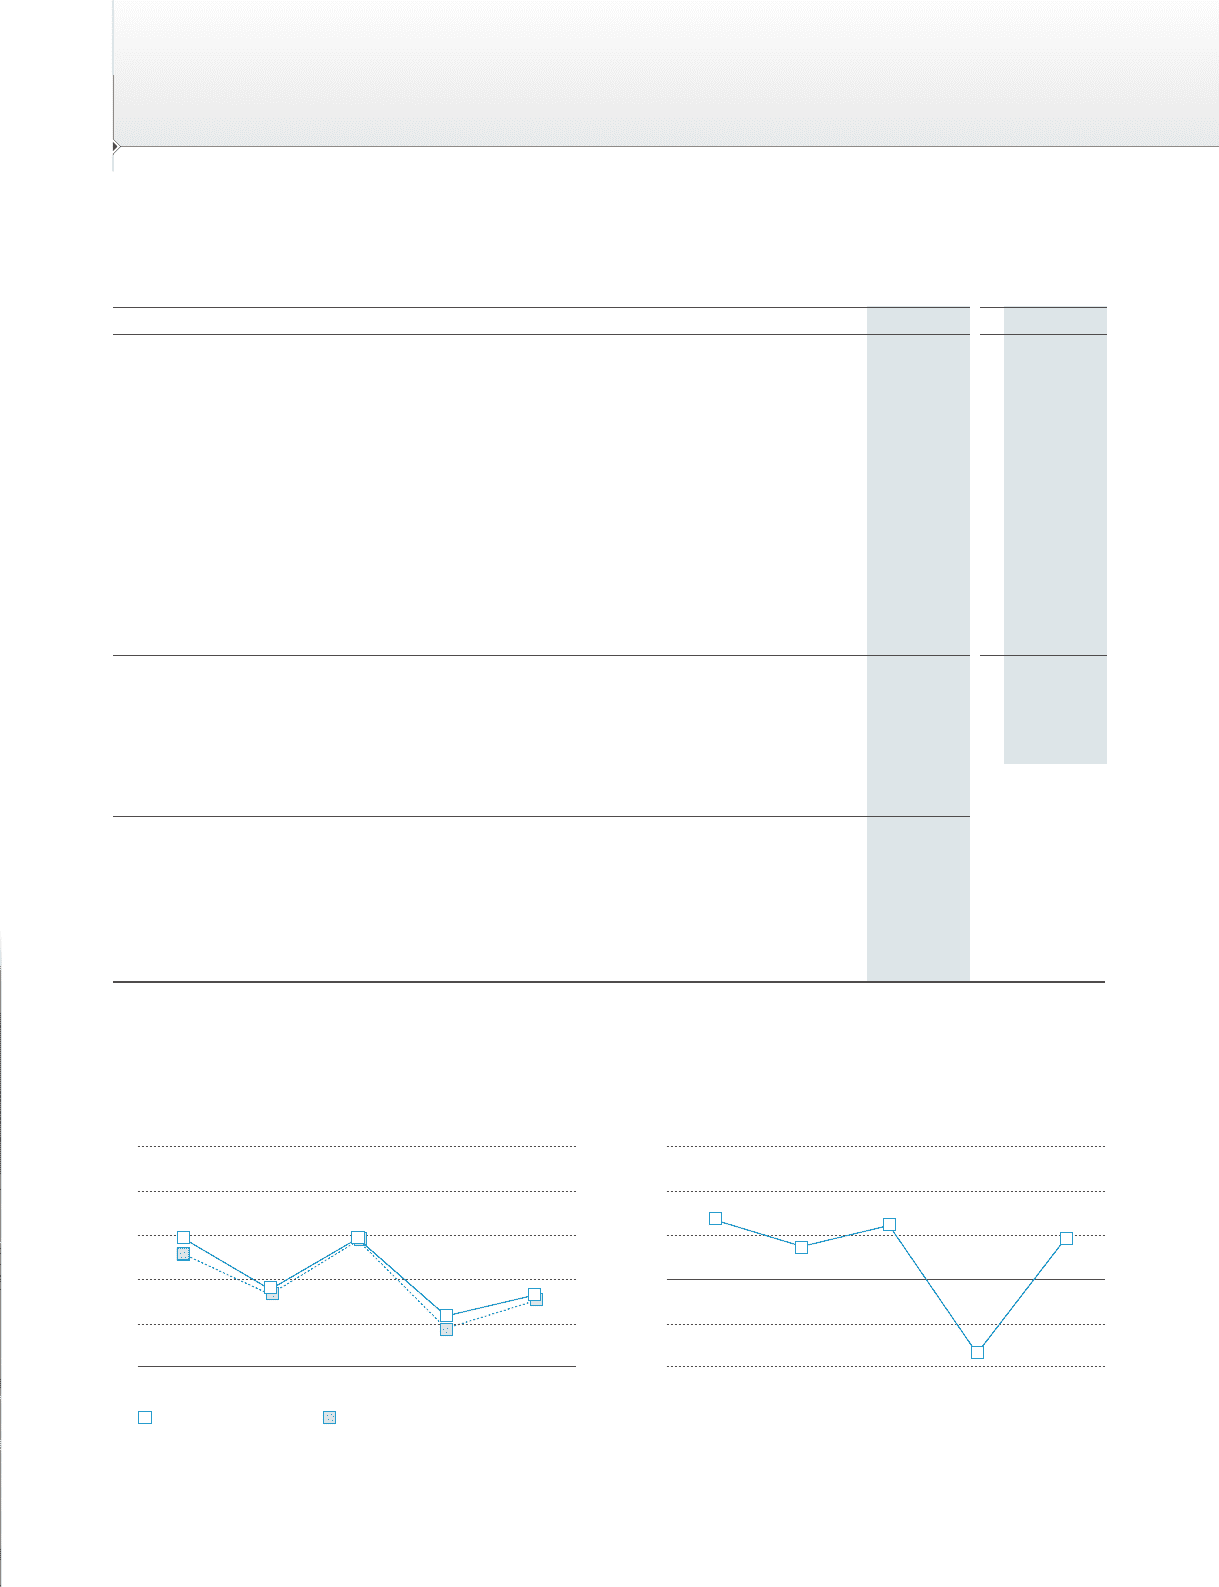
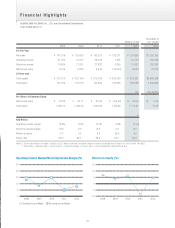
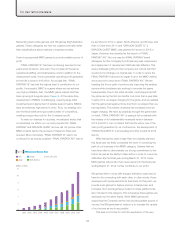
Operating Income Margin/Recurring Income Margin (%) Return on Equity (%)
Notes: 1. For the convenience of readers, amounts in U.S. dollars have been translated using the currency exchange rates at March 31, 2012 of ¥82.19=US$1.
2. Total equity = Common stock + Capital surplus + Retained earnings + Treasury stock + Accumulated other comprehensive loss
Thousands of
U.S. DollarsMillions of Yen
2008 2009 2010 2011 2012 2012
For the Year
Net sales ¥ 147,516 ¥ 135,693 ¥ 192,257 ¥ 125,271 ¥ 127,896 $1,556,105
Operating income 21,520 12,277 28,235 7,325 10,713 130,349
Recurring income 18,864 11,261 27,822 5,390 10,297 125,292
Net income (loss) 9,196 6,333 9,509 (12,043) 6,060 73,733
At Year-end
Total assets ¥ 212,134 ¥ 213,194 ¥ 270,529 ¥ 206,336 ¥ 213,981 $2,603,498
Total equity 147,034 147,318 152,680 133,558 135,536 1,649,062
Yen U.S. Dollars
Per Share of Common Stock
Net income (loss) ¥ 81.85 ¥ 55.11 ¥ 82.65 ¥ (104.66) ¥ 52.66 $ 0.64
Total equity 1,280.50 1,280.92 1,326.82 1,160.66 1,177.87 14.33
%
Key Ratios
Operating income margin 14.6% 9.0% 14.7% 5.8% 8.4%
Recurring income margin 12.8 8.3 14.5 4.3 8.0
Return on equity 6.7 4.3 6.3 (8.4) 4.5
Equity ratio 69.3 69.1 56.4 64.7 63.3
Operating Income Margin Recurring Income Margin
25
20
15
10
5
0
2011 20122008 2009 2010
15
10
5
0
-5
-10
2011 20122008 2009 2010
Financial Highlights
SQUARE ENIX HOLDINGS CO., LTD. and Consolidated Subsidiaries
Years Ended March 31
01