Square Enix 2012 Annual Report Download - page 10
Download and view the complete annual report
Please find page 10 of the 2012 Square Enix annual report below. You can navigate through the pages in the report by either clicking on the pages listed below, or by using the keyword search tool below to find specific information within the annual report.-
 1
1 -
 2
2 -
 3
3 -
 4
4 -
 5
5 -
 6
6 -
 7
7 -
 8
8 -
 9
9 -
 10
10 -
 11
11 -
 12
12 -
 13
13 -
 14
14 -
 15
15 -
 16
16 -
 17
17 -
 18
18 -
 19
19 -
 20
20 -
 21
21 -
22
-
23
-
24
-
25
-
26
-
27
-
28
-
29
-
30
-
31
-
32
-
33
-
34
-
35
-
36
-
37
-
38
-
39
-
40
-
41
-
42
-
43
-
44
-
45
-
46
-
47
-
48
-
49
-
50
-
51
-
52
-
53
-
54
-
55
-
56
-
57
-
58
-
59
-
60
-
61
-
62
-
63
-
64
 |
 |
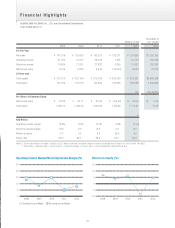
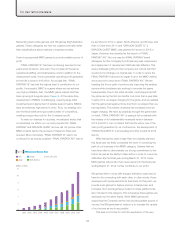
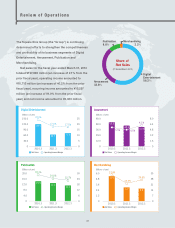
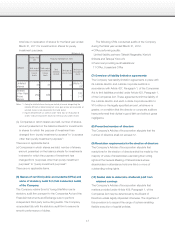
The Square Enix Group (the “Group”) is continuing
determined efforts to strengthen the competitiveness
and profitability of its business segments of Digital
Entertainment, Amusement, Publication and
Merchandising.
Net sales for the fiscal year ended March 31, 2012
totaled ¥127,896 million (an increase of 2.1% from the
prior fiscal year), operating income amounted to
¥10,713 million (an increase of 46.2% from the prior
fiscal year), recurring income amounted to ¥10,297
million (an increase of 91.0% from the prior fiscal
year) and net income amounted to ¥6,060 million.
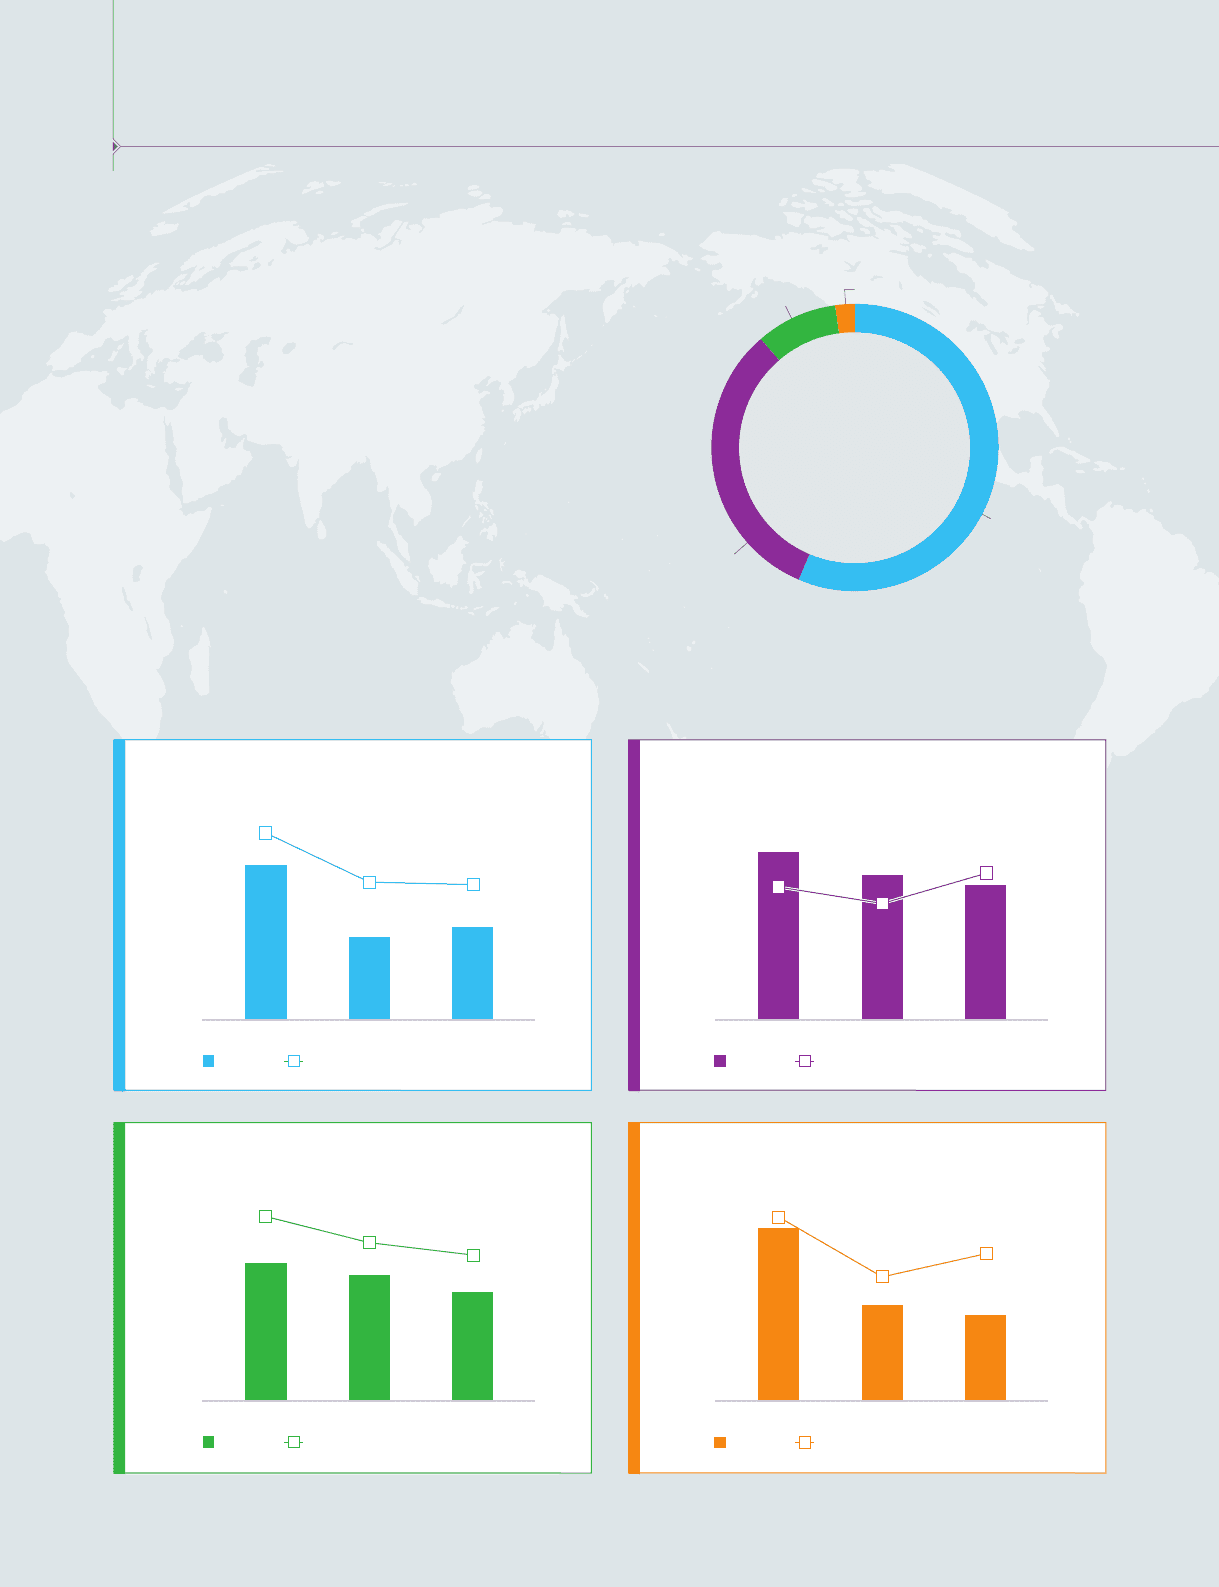
56.2%
Digital
Entertainment
32.8%
Amusement
8.8%
Publication
2.2%
Merchandising
Share of
Net Sales
(FY Ended March 2012)
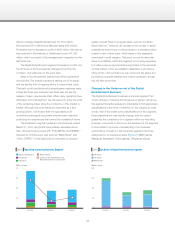
Review of Operations
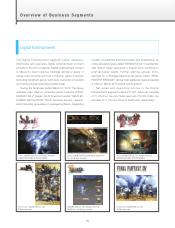
Digital Entertainment
2010.3 2011.3 2012.3
(Billions of yen)
150.0
120.0
90.0
60.0
30.0
0
25
20
15
10
5
0
120.1
24.2%
17.6% 17.5%
64.2 71.9
Net Sales Operating Income Margin
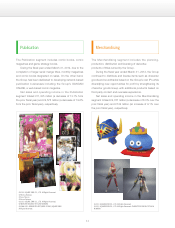
Publication
2010.3 2011.3 2012.3
(Billions of yen)
20.0
16.0
12.0
8.0
4.0
0
30
24
18
12
6
0
28.7%
24.6% 22.7%
Net Sales Operating Income Margin
14.4 13.0 11.3
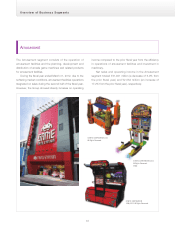
Amusement
2010.3 2011.3 2012.3
(Billions of yen)
60.0
48.0
36.0
24.0
12.0
0
8.0
6.4
4.8
3.2
1.6
0
52.3
5.5% 4.8%
6.1%
45.0 41.9
Net Sales Operating Income Margin
Merchandising
2010.3 2011.3 2012.3
(Billions of yen)
6.0
4.8
3.6
2.4
1.2
0
35
28
21
14
7
0
33.4%
22.6%
26.8%
Net Sales Operating Income Margin
5.5
3.0 2.8
08