Square Enix 2012 Annual Report Download - page 5
Download and view the complete annual report
Please find page 5 of the 2012 Square Enix annual report below. You can navigate through the pages in the report by either clicking on the pages listed below, or by using the keyword search tool below to find specific information within the annual report.-
 1
1 -
 2
2 -
 3
3 -
 4
4 -
 5
5 -
 6
6 -
 7
7 -
 8
8 -
 9
9 -
 10
10 -
 11
11 -
 12
12 -
 13
13 -
 14
14 -
 15
15 -
 16
16 -
17
-
18
-
19
-
20
-
21
-
22
-
23
-
24
-
25
-
26
-
27
-
28
-
29
-
30
-
31
-
32
-
33
-
34
-
35
-
36
-
37
-
38
-
39
-
40
-
41
-
42
-
43
-
44
-
45
-
46
-
47
-
48
-
49
-
50
-
51
-
52
-
53
-
54
-
55
-
56
-
57
-
58
-
59
-
60
-
61
-
62
-
63
-
64
 |
 |
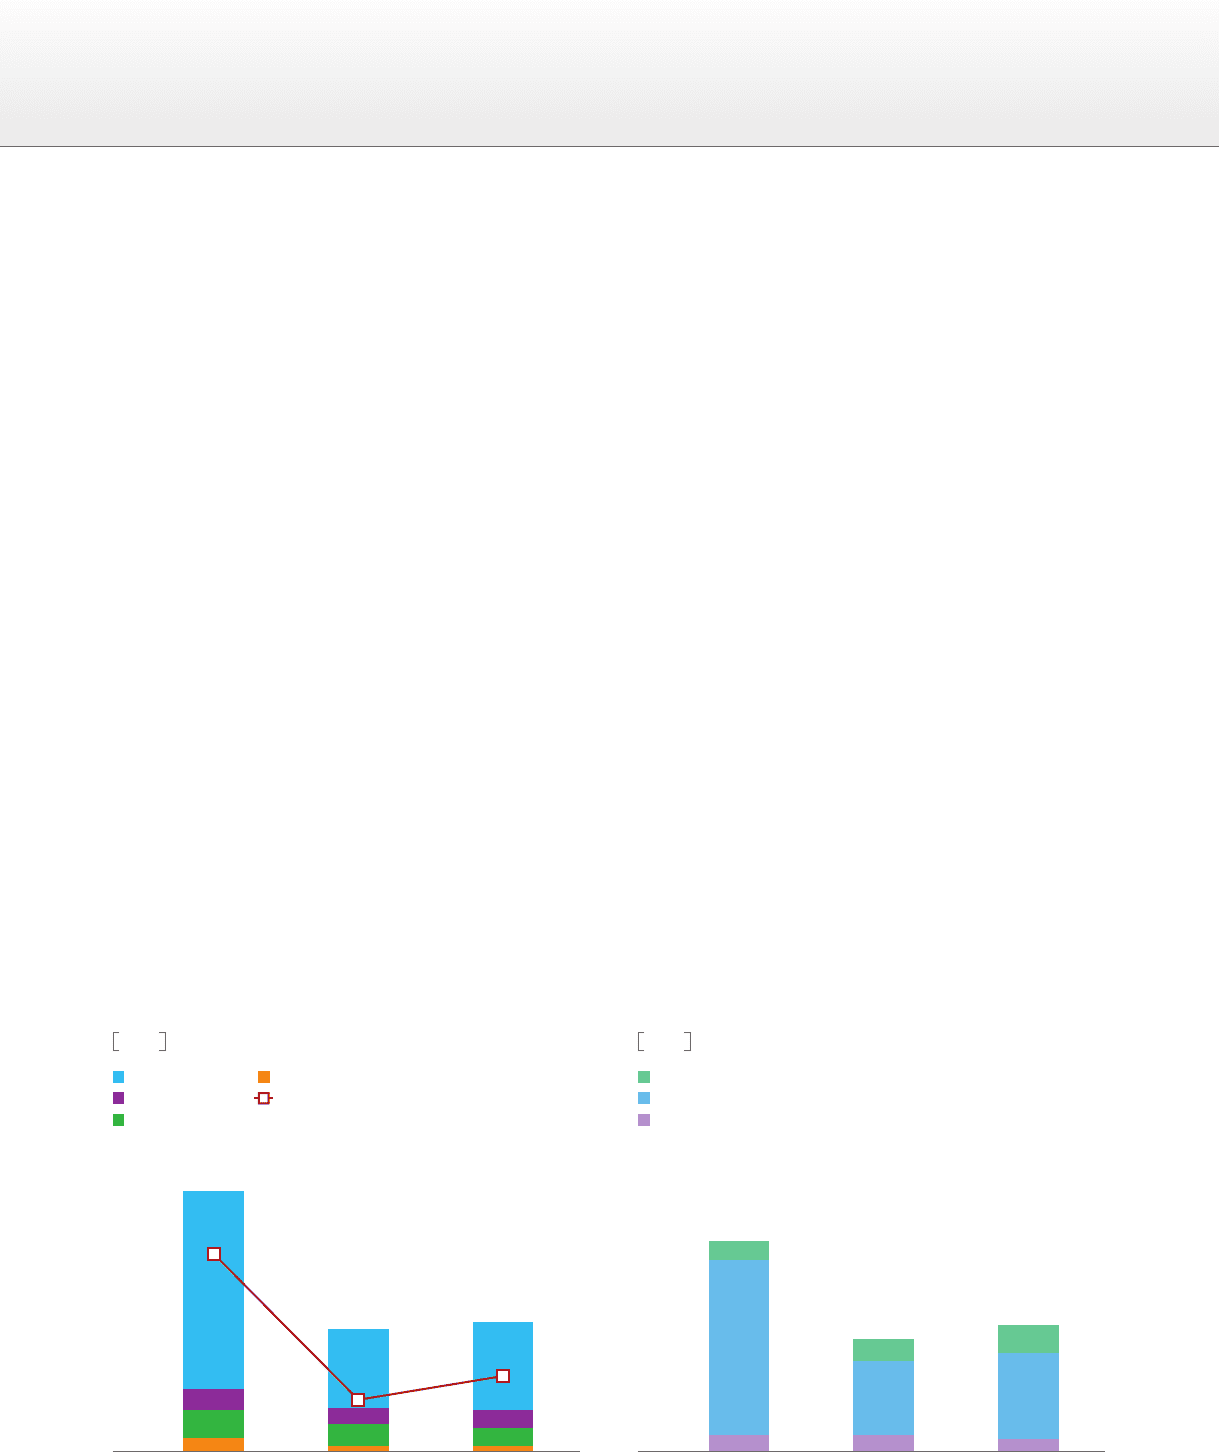
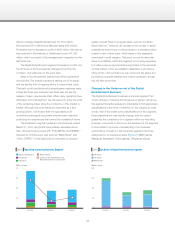
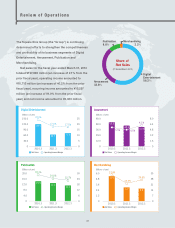
saw an increase: Digital Entertainment (¥1,319 million),
Amusement (¥374 million) and Merchandising (¥62 million).
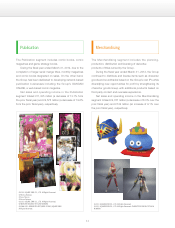
Publication had a decrease in profit of ¥629 million. We saw an
improvement in Eliminations or Unallocated cost of ¥2,262
million, which is a result of the reassessment of assets from the
last fiscal year.
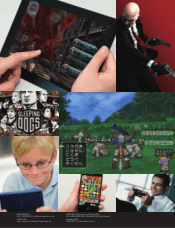
The Digital Entertainment segment increased in profits, but
the structure of the business has changed more than the
numbers. I will elaborate on this point later.
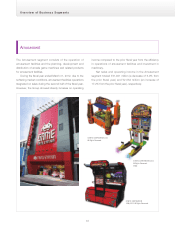
Sales in the Amusement segment are flat but generated
more profits. The arcade business is getting out of its slump,
and we see the fruit of ongoing efforts to reduce fixed costs.
That said, profit contributions by arcade game machines were
limited this fiscal year whereas next fiscal year will see the
release of major, new arcade titles. While many operators have
withdrawn from this segment, we can expect to enjoy the profit
of the remaining player since the contraction of the market is
limited. Although this could hardly be described as a fast-
growing sector, I will ensure that it brings stable profit
contributions alongside its primary entertainment objective:
producing live experiences that cannot be recreated at home.
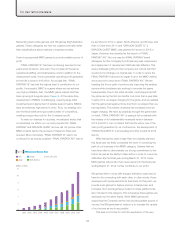
The Publication segment peaked in the fiscal year ended
March 31, 2010, and profits have steadily decreased since
then. We saw huge success with “FULLMETAL ALCHEMIST,”
followed by hit titles every year such as “Black Butler” and
“SOUL EATER.” In this fiscal year we were able to produce
quality, popular titles on a regular basis, such as “Inu Boku
Secret Service.” However, an increase in the number of serial
publications and a focus on the production of animated series
created a rise in fixed costs, which leads to this segment’s
downtrend in profit margins. That said, a more fundamental
issue of profitability within this segment is not rising expenses,
but rather revenue opportunities being limited to the domestic
comics market. Once we establish capabilities to produce a
string of hits, I am confident we can overcome the status quo
by entering overseas markets and online businesses, though
this will take some time.
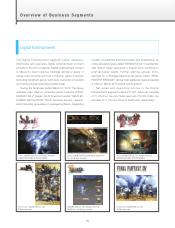
Changes in the Undercurrent of the Digital
Entertainment Business
The Digital Entertainment business is a broad segment that
covers all types of devices and all genres of games. We group
this segment broadly because it is impossible to find appropriate
classifications in this time of transition for the industry. In other
words, even if we create some classifications for this segment,
those classifications may rapidly change, and we cannot
guarantee the consistency of a segment within our reporting.
However, I would like to show you a breakdown of the segment
in more detail to promote understanding of our business
performance. Therefore, I will divide this segment into three
categories for convenience’s sake (Figure 2): MMO games
(Massively Multiplayer Online games), SN games (Social
Operating Income by Business Segment
Figure 1
Digital Entertainment
Amusement
Merchandising
Company Total Operating Income
(Net of eliminations or unallocated)
Publication
(Billions of yen)
FY2010 FY2011 FY2012
40
30
20
10
0
SN Games
HD Games
MMO Games
(Billions of yen)
160
120
80
40
0
FY2010 FY2011 FY2012
Net Sales of Digital Entertainment Segment
Figure 2
03