Square Enix 2012 Annual Report Download - page 24
Download and view the complete annual report
Please find page 24 of the 2012 Square Enix annual report below. You can navigate through the pages in the report by either clicking on the pages listed below, or by using the keyword search tool below to find specific information within the annual report.-
 1
1 -
2
-
3
-
4
-
5
-
6
-
7
-
8
-
9
-
10
-
11
-
12
-
13
-
 14
14 -
 15
15 -
 16
16 -
 17
17 -
 18
18 -
 19
19 -
 20
20 -
 21
21 -
 22
22 -
 23
23 -
 24
24 -
 25
25 -
 26
26 -
 27
27 -
 28
28 -
 29
29 -
 30
30 -
 31
31 -
 32
32 -
 33
33 -
 34
34 -
35
-
36
-
37
-
38
-
39
-
40
-
41
-
42
-
43
-
44
-
45
-
46
-
47
-
48
-
49
-
50
-
51
-
52
-
53
-
54
-
55
-
56
-
57
-
58
-
59
-
60
-
61
-
62
-
63
-
64
 |
 |
22
2. Analysis of Financial Policy, Capital Resources and
Liquidity
The Group meets its working capital and capital investment
requirements principally through internal funding resources and the
issuance of corporate bonds. As of March 31, 2012, the Group’s
balance of interest-bearing debt was ¥5,253 million. The net assets
ratio stood at 63.3%. Cash and cash equivalents at the end of the
year totaled ¥110,116 million, an increase of ¥364 million
compared with the prior fiscal year-end.
Cash flows in the fiscal year ended March 31, 2012, as well as
the principal factors behind these cash flows, are described below.
(1) Net Cash Provided by Operating Activities
Net cash provided by operating activities totaled ¥6,786 million, a
decrease of 54.2% compared with the previous fiscal year.
Income before income taxes and minority interests of ¥9,866
million and the depreciation and amortization of ¥5,039 million were
significant contributors to positive cash flows from operating
activities despite the increase in inventories of ¥5,137 million and
accounts receivable of ¥3,008 million.
(2) Net Cash Used in Investing Activities
Net cash used in investing activities totaled ¥5,778 million,
compared to net cash provided by investing activities of ¥30,407
million in the prior fiscal year. The main factors are proceeds from
collection of guarantee deposits of ¥1,084 million, payments for
guarantee deposits of ¥1,492 million, and purchase of property and
equipment of ¥4,620 million.
(3) Net Cash Provided by Financing Activities
Net cash provided by financing activities totaled ¥299 million,
compared to net cash used in financing activities of ¥42,354 million
in the prior fiscal year. The main factors are an increase in short-
term loans payable of ¥3,791 million and cash dividends paid of
¥3,446 million.
The Group believes that it will be possible to procure the funds
required for working capital and capital investments in the future to
maintain growth based on its sound financial standing and ability to
generate cash through operating activities.
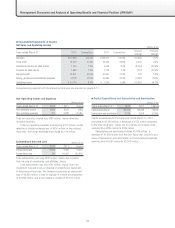
3. Analysis of Business Performance in the Fiscal Year
Ended March 31, 2012
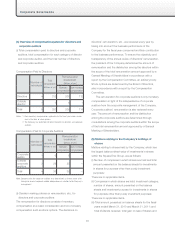
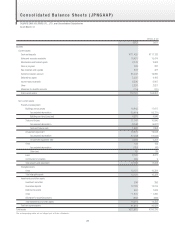
■ Assets
Total Assets Millions of yen
March 31 2012 2011 Change
¥213,981 ¥206,336 ¥7,645
Total assets as of March 31, 2012 amounted to ¥213,981 million,
an increase of ¥7,645 million compared with the prior fiscal year.
The main factors contributing to the change were as follows:
Cash and Deposits
Millions of yen
March 31 2012 2011 Change
¥111,495 ¥111,126 ¥369
Notes and Accounts Receivable Millions of yen
March 31 2012 2011 Change
¥18,431 ¥15,474 ¥2,957
The year-end balance of notes and accounts receivable varies
greatly depending on the timing of new game title releases. In the
fiscal year ended March 31, 2012, notes and accounts receivable
increased by ¥2,957 million to ¥18,431 million, mainly due to the
March release of “KINGDOM HEARTS 3D” in Japan.
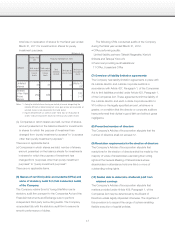
Content Production Account Millions of yen
March 31 2012 2011 Change
¥25,047 ¥19,890 ¥5,157
As a rule, content development costs incurred during the period
from a title’s formal development authorization through to its
release are capitalized in the content production account. When the
title is released, this amount is then recorded as an expense.
As of March 31, 2012, the content production account totaled
¥25,047 million, an increase of ¥5,157 million compared with the
prior fiscal year.
Property and Equipment Millions of yen
March 31 2012 2011 Change
¥17,183 ¥17,328 ¥(144)
Total property and equipment totaled ¥17,183 million, down ¥144
million from the prior fiscal year, primarily due to a decline in
buildings and structures from ¥4,846 million to ¥4,231 million.
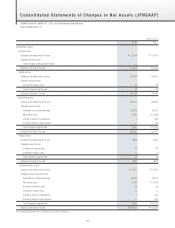
Management Discussion and Analysis of Operating Results and Financial Position (JPNGAAP)